

Question: Question 1 ( 7marks) Use the following sample data to calculate the following summary statistics X Y 5 20 50 4 10 5 20 5
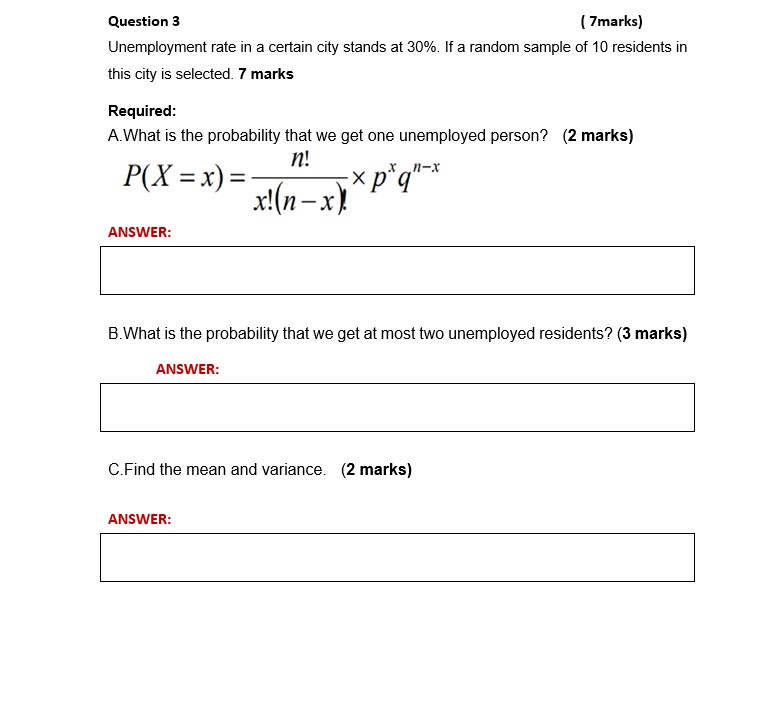
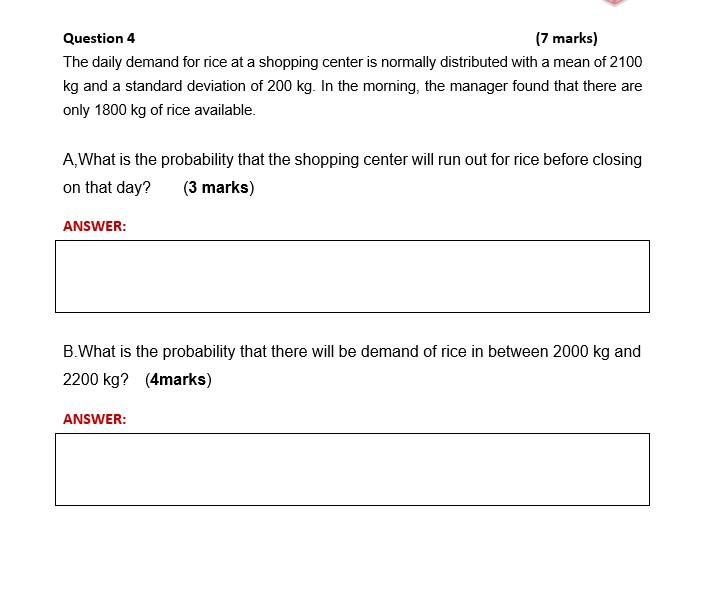
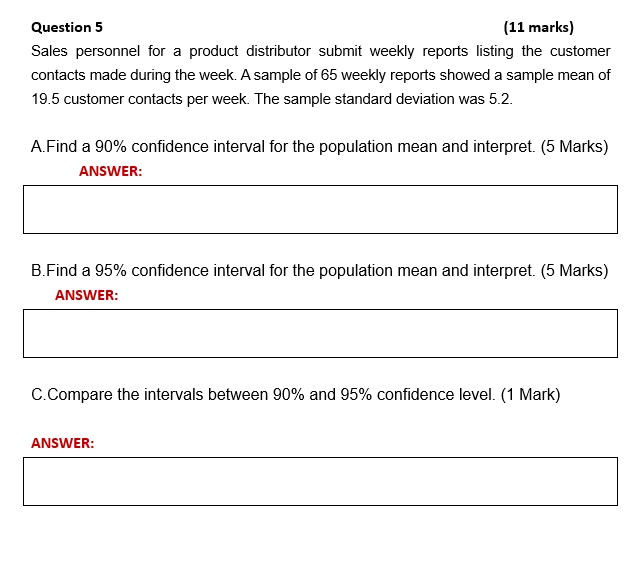
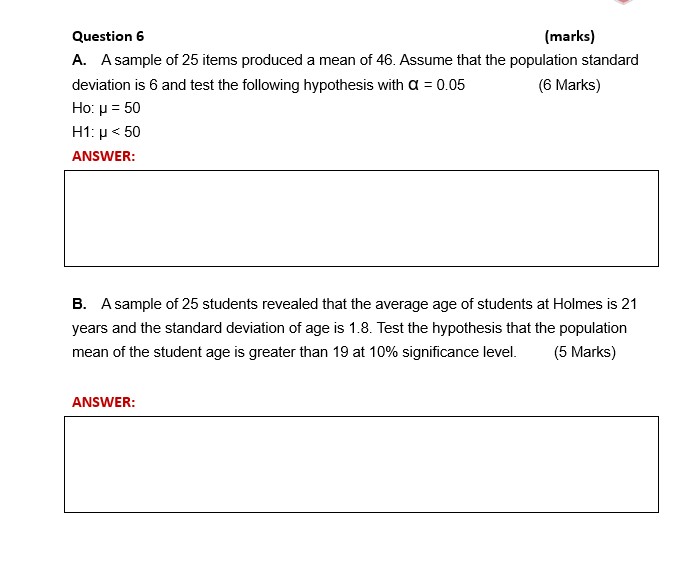
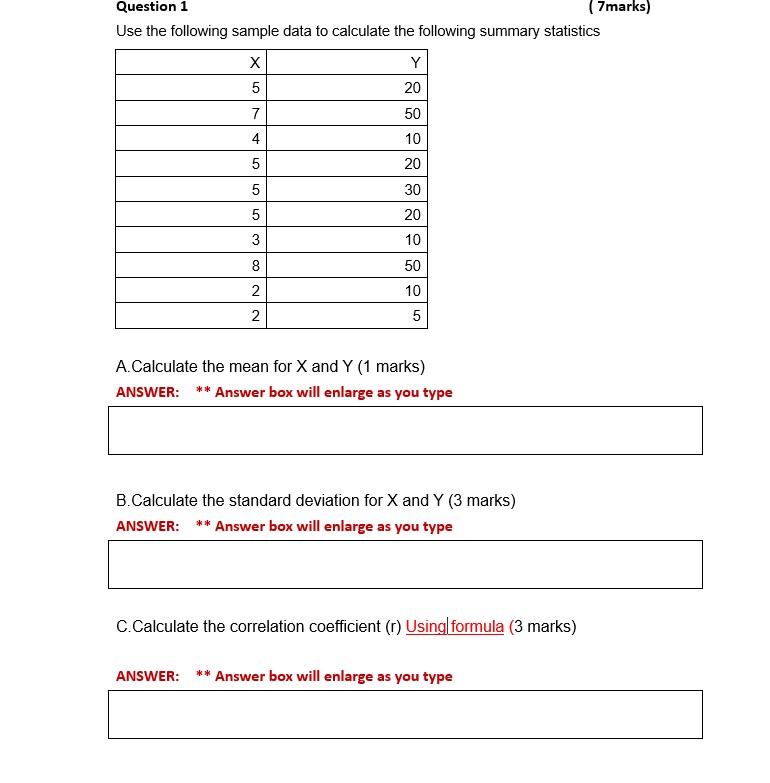
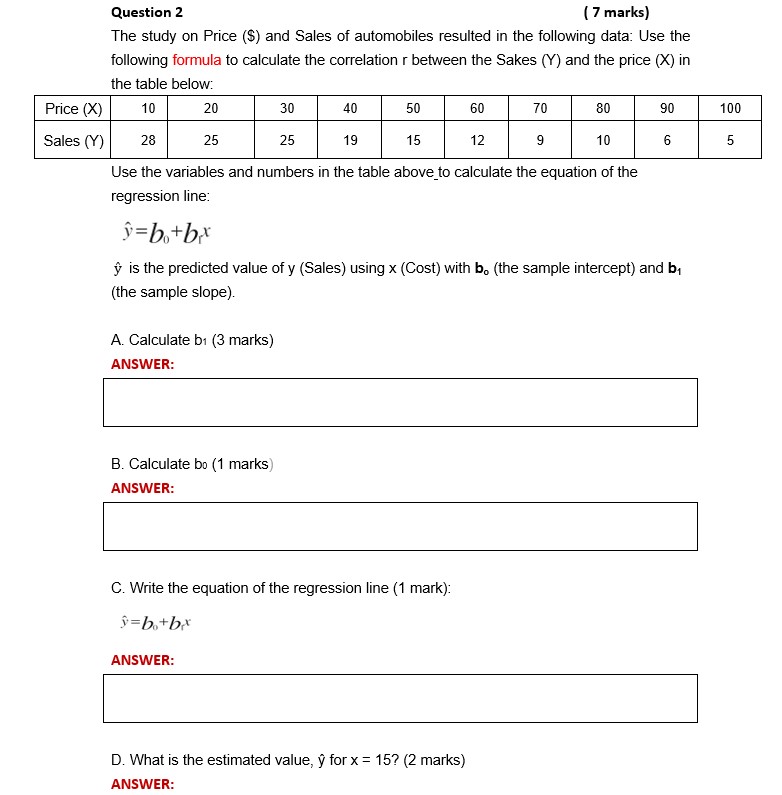


Question 1 ( 7marks) Use the following sample data to calculate the following summary statistics X Y 5 20 50 4 10 5 20 5 30 20 10 50 IN 10 2 5 A. Calculate the mean for X and Y (1 marks) ANSWER: ** Answer box will enlarge as you type B. Calculate the standard deviation for X and Y (3 marks) ANSWER: ** Answer box will enlarge as you type C. Calculate the correlation coefficient (r) Using formula (3 marks) ANSWER: ** Answer box will enlarge as you typeQuestion 2 ( 7 marks) The study on Price ($) and Sales of automobiles resulted in the following data: Use the following formula to calculate the correlation r between the Sakes (Y) and the price (X) in the table below: Price (X) 10 20 30 40 50 60 70 80 90 100 Sales (Y) 28 25 25 19 15 12 9 10 6 5 Use the variables and numbers in the table above to calculate the equation of the regression line: y=botbox y is the predicted value of y (Sales) using x (Cost) with b. (the sample intercept) and by (the sample slope). A. Calculate b1 (3 marks) ANSWER: B. Calculate bo (1 marks) ANSWER: C. Write the equation of the regression line (1 mark): ANSWER: D. What is the estimated value, y for x = 15? (2 marks) ANSWER:Question 3 I Inherits] Unemployment rate in a certain city stands at 30%. If a random sample of \"[0 residents in this city is selected. 7 marks Required: A.What is the probability that we get one unemployed person? (2 marks] :11 P X = = I 11): ( I) x!(nxlxp q ANSWER: B_What is the probability that we get at most two unemployed residents? {3 marks] ANSWER: : C_Find the mean and variance. (2 marks) ANSWER: : Question 4 (7 marks) The daily demand for rice at a shopping center is normally distributed with a mean of 2100 kg and a standard deviation of 200 kg. In the morning, the manager found that there are only 1800 kg of rice available. A, What is the probability that the shopping center will run out for rice before closing on that day? (3 marks) ANSWER: B.What is the probability that there will be demand of rice in between 2000 kg and 2200 kg? (4marks) ANSWER:Question 5 (11 marks) Sales personnel for a product distributor submit weekly reports listing the customer contacts made during the week. A sample of 65 weekly reports showed a sample mean of 19.5 customer contacts per week. The sample standard deviation was 5.2. A.Find a 90% confidence interval for the population mean and interpret. (5 Marks) ANSWER: B.Find a 95% confidence interval for the population mean and interpret. (5 Marks) ANSWER: C.Compare the intervals between 90% and 95% confidence level. (1 Mark) ANSWER:Question 6 (marks) A. A sample of 25 items produced a mean of 46. Assume that the population standard deviation is 6 and test the following hypothesis with a = 0.05 (6 Marks) Ho: p = 50 H1: p
Step by Step Solution
There are 3 Steps involved in it

Get step-by-step solutions from verified subject matter experts