

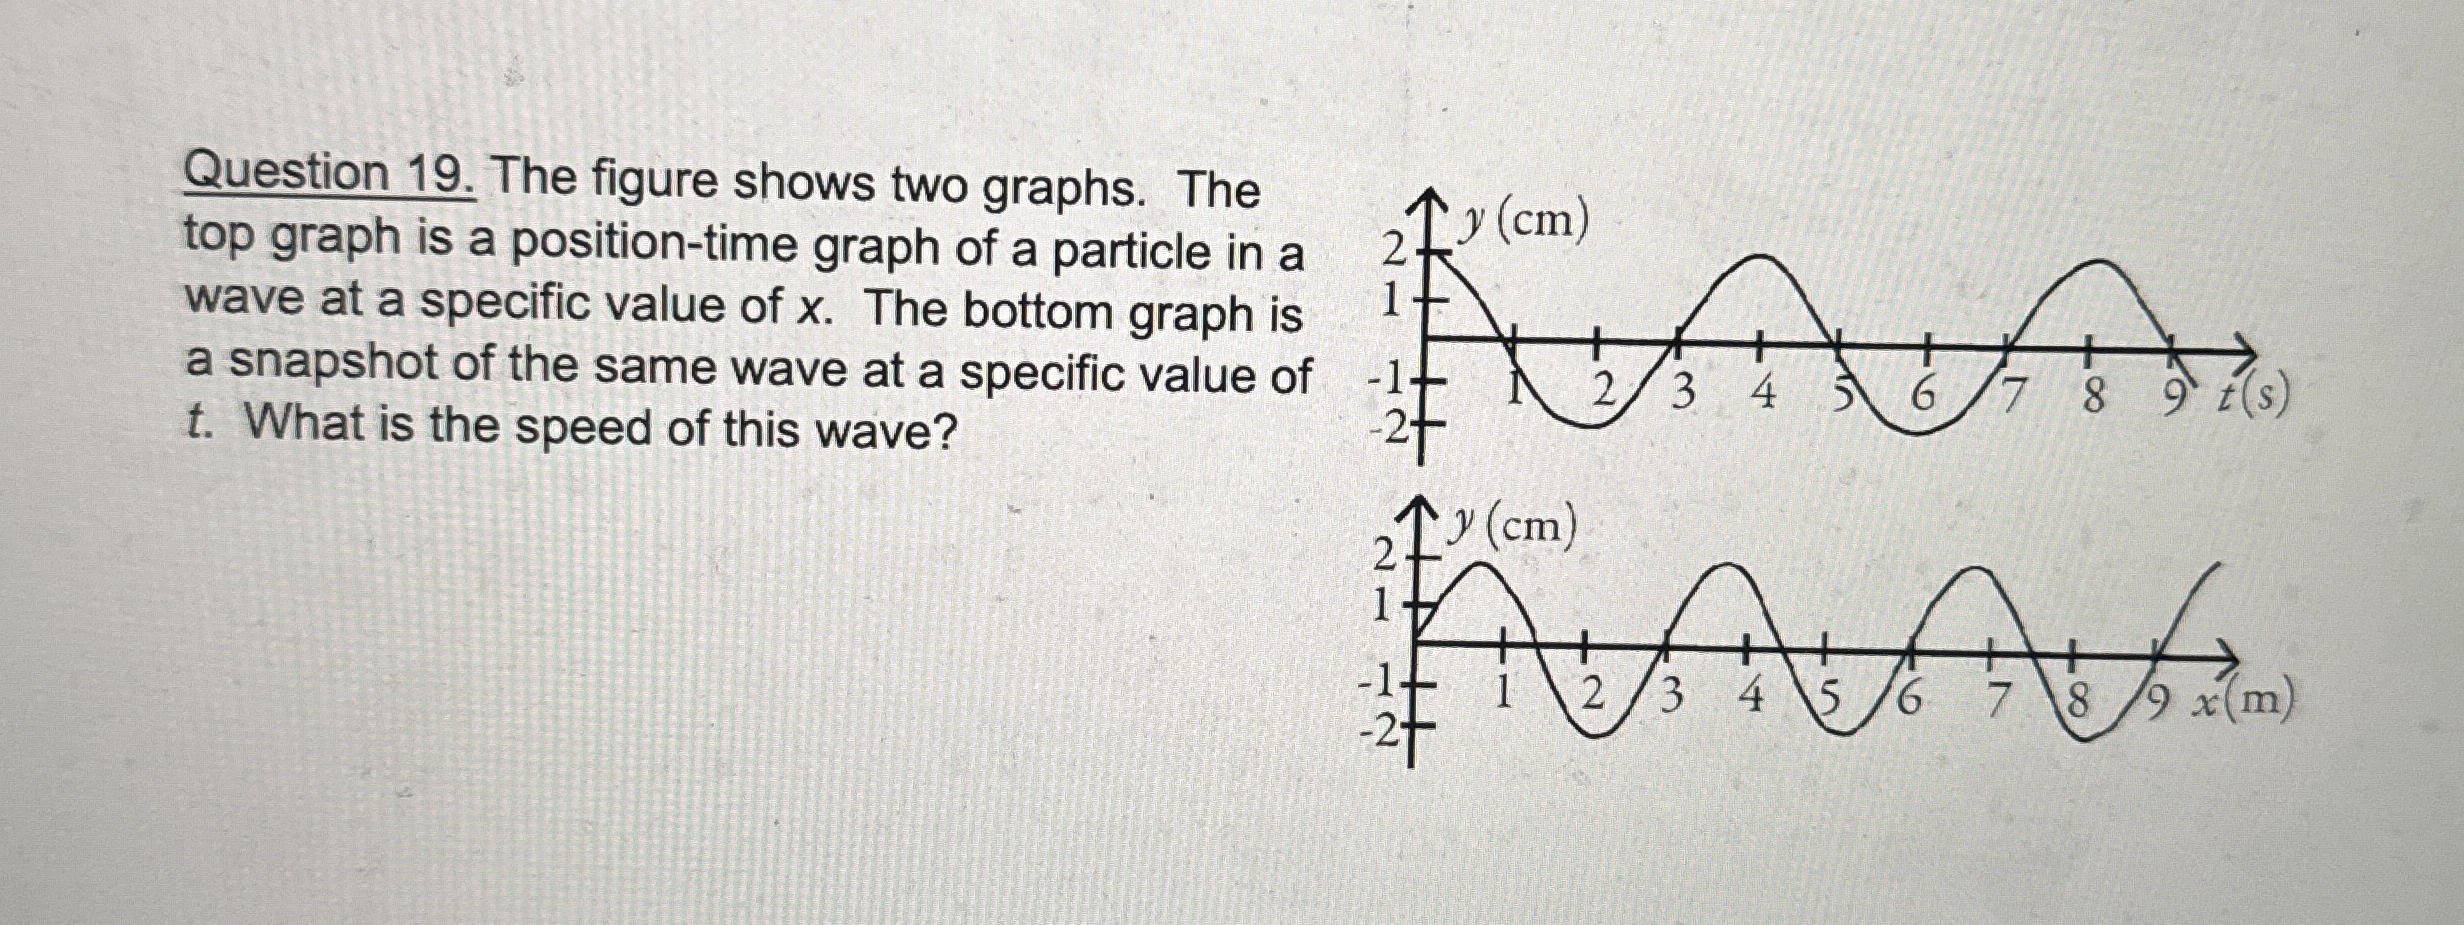
Question: Question 1 9 . The figure shows two graphs. The top graph is a position - time graph of a particle in a wave at
Question The figure shows two graphs. The top graph is a positiontime graph of a particle in a wave at a specific value of The bottom graph is a snapshot of the same wave at a specific value of What is the speed of this wave?
Step by Step Solution
There are 3 Steps involved in it
1 Expert Approved Answer
Step: 1 Unlock

Question Has Been Solved by an Expert!
Get step-by-step solutions from verified subject matter experts
Step: 2 Unlock
Step: 3 Unlock