

Question: Question 1 9 The graph below shows the relationship between fixed costs and profit variable costs and profit variable costs and volume of sales fixed
Question
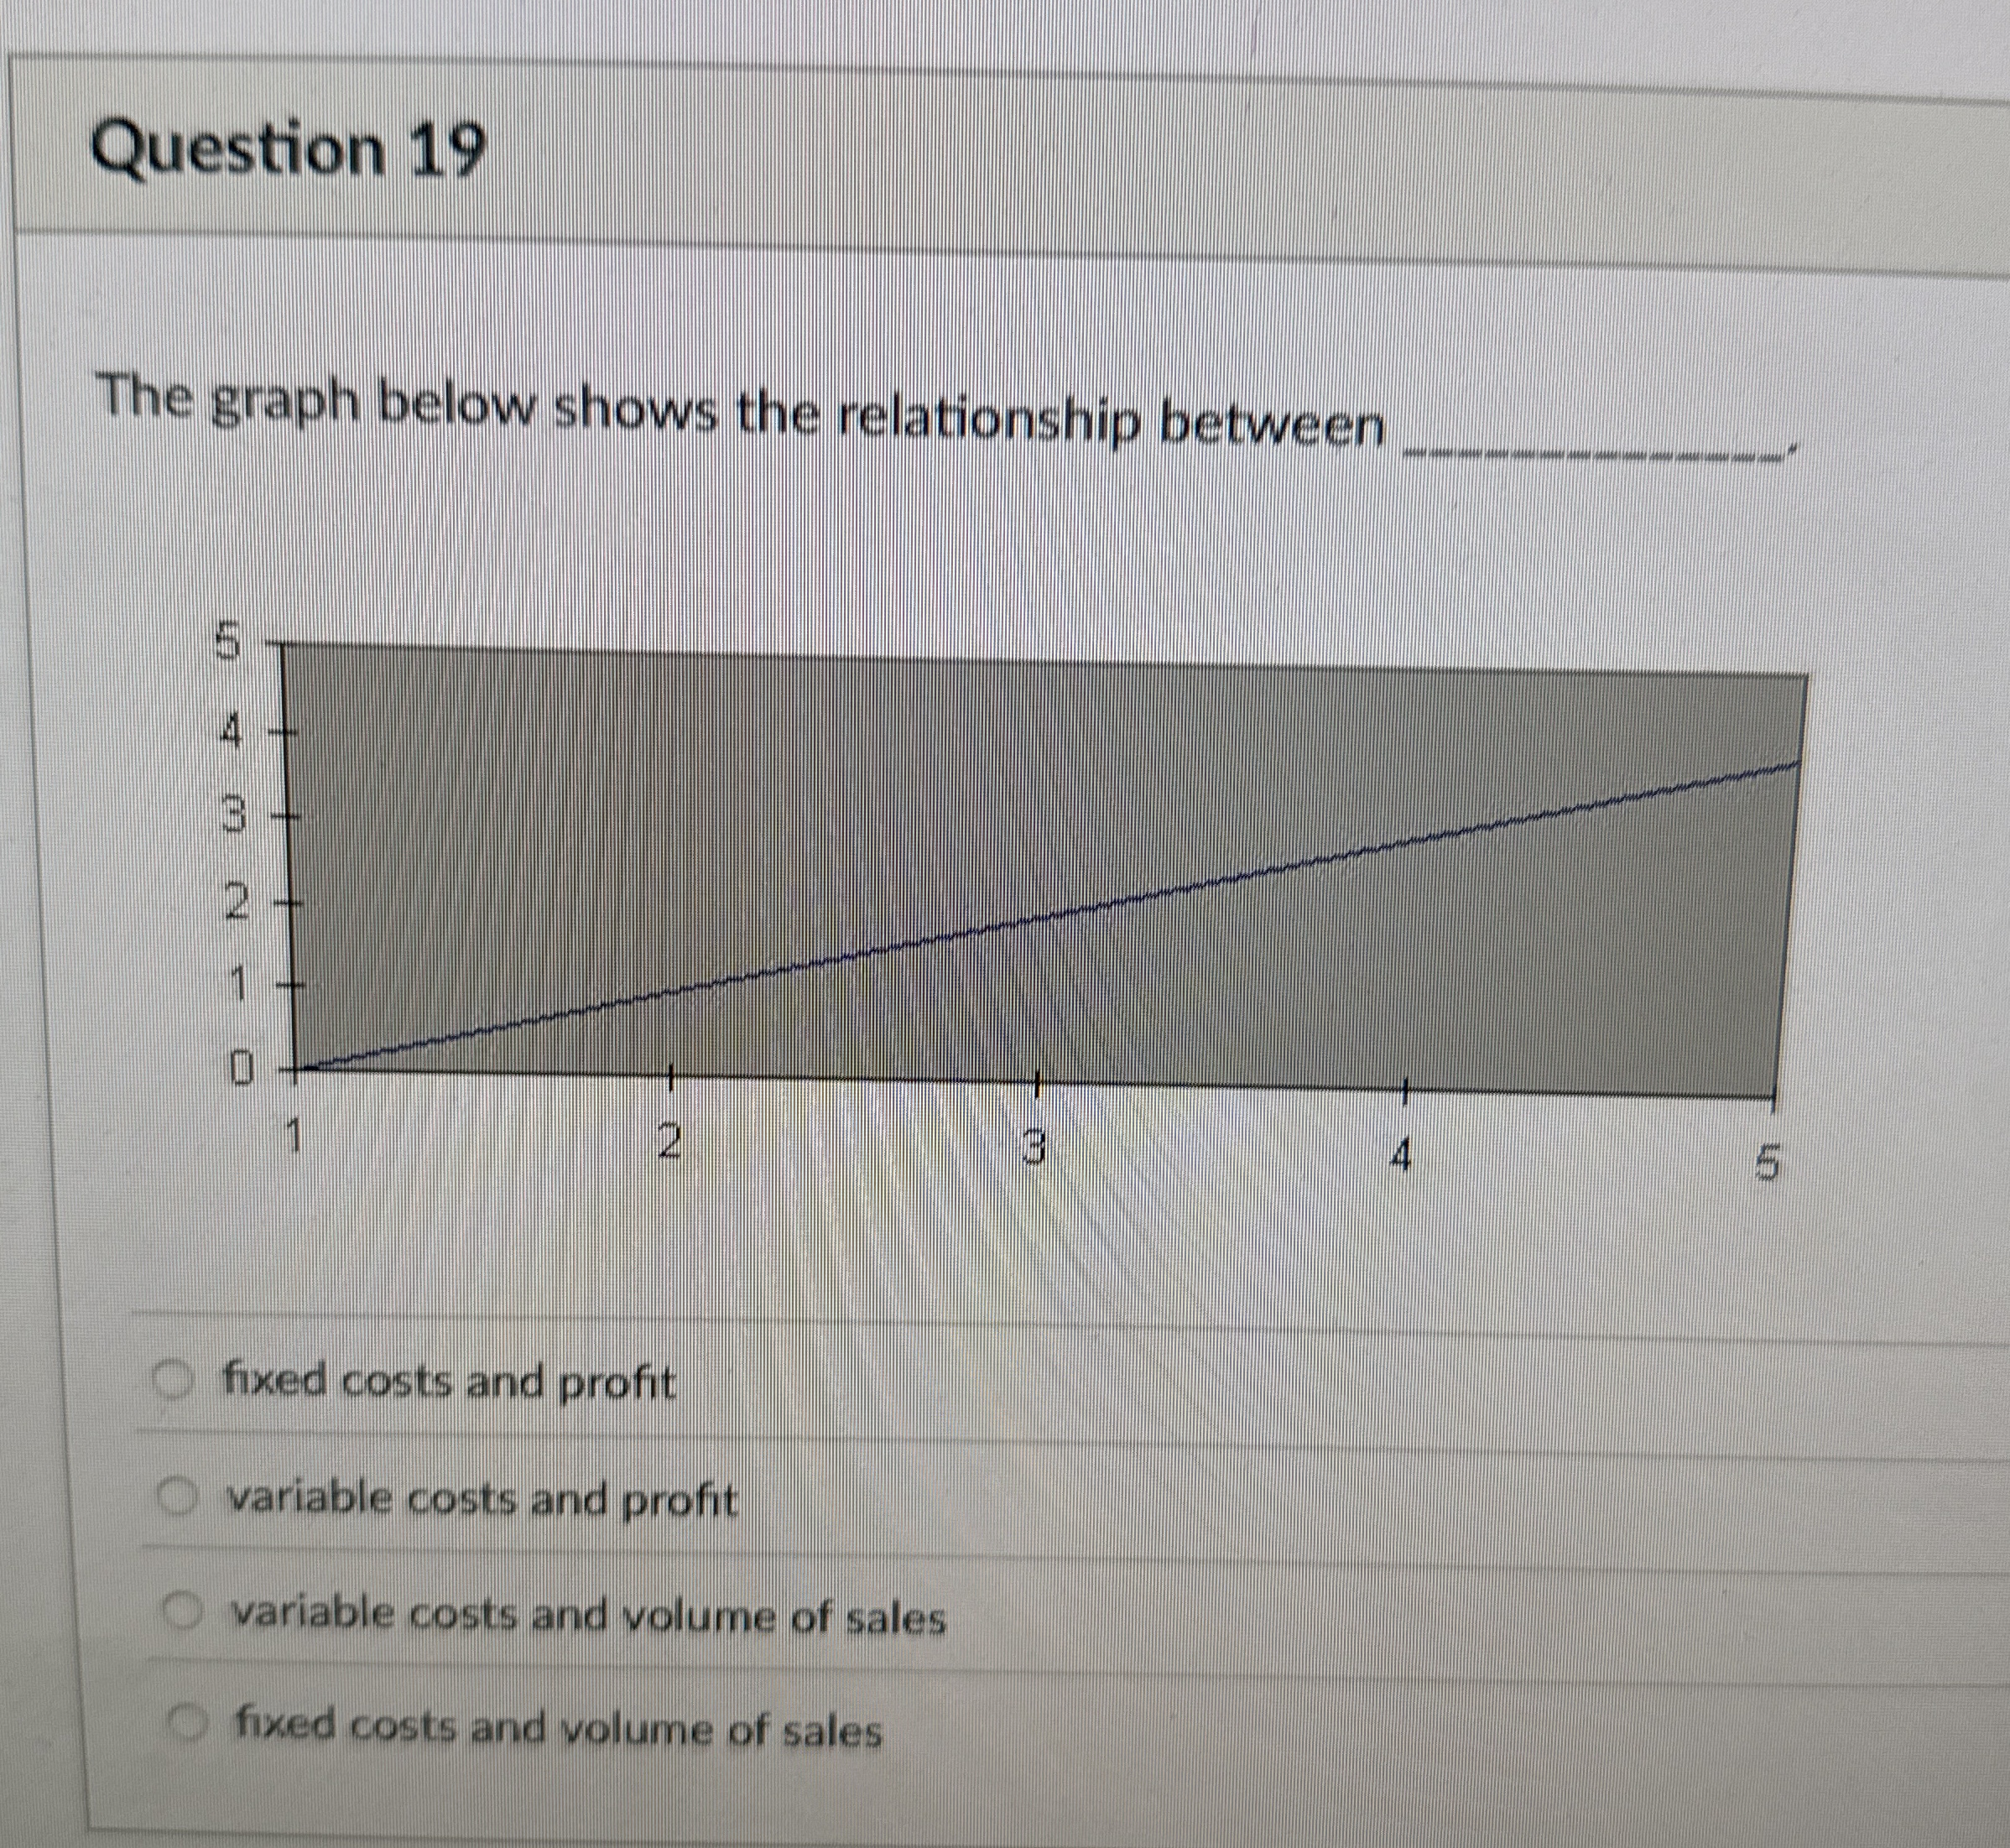
The graph below shows the relationship between
fixed costs and profit
variable costs and profit
variable costs and volume of sales
fixed costs and volume of sales
Step by Step Solution
There are 3 Steps involved in it
1 Expert Approved Answer
Step: 1 Unlock

Question Has Been Solved by an Expert!
Get step-by-step solutions from verified subject matter experts
Step: 2 Unlock
Step: 3 Unlock