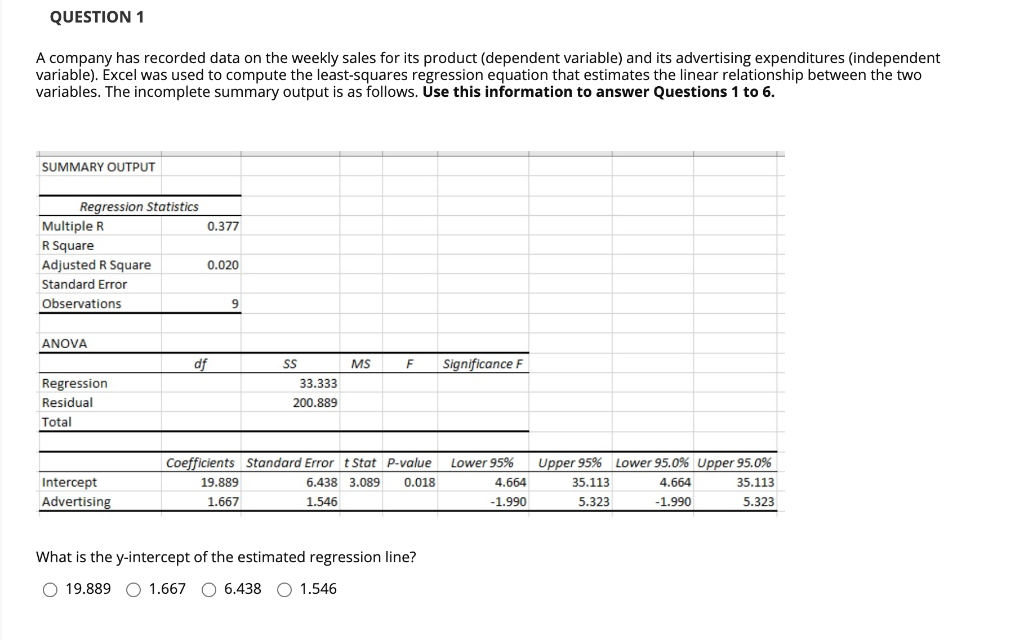
Question: QUESTION 1 A company has recorded data on the weekly sales for its product (dependent variable) and its advertising expenditures (independent variable). Excel was used

QUESTION 1 A company has recorded data on the

QUESTION 1 A company has recorded data on the weekly sales for its product (dependent variable) and its advertising expenditures (independent variable). Excel was used to compute the least-squares regression equation that estimates the linear relationship between the two variables. The incomplete summary output is as follows. Use this information to answer Questions 1 to 6. SUMMARY OUTPUT 0.377 Regression Statistics Multiple R R Square Adjusted R Square Standard Error Observations 0.020 9 ANOVA df MS F Significance F Regression Residual Total SS 33.333 200.889 Intercept Advertising Coefficients Standard Erre t Stat p-value 19.889 6.438 3.089 0.018 1.667 1.546 Lower 95% 4.664 -1.990 Upper 95% 35.113 5.323 Lower 95.0% Upper 95.0% 4.664 35.113 -1.990 5.323 What is the y-intercept of the estimated regression line? O 19.889 O 1.667 0 6.438 O 1.546

Step by Step Solution

There are 3 Steps involved in it

1 Expert Approved Answer
Step: 1 Unlock blur-text-image
Question Has Been Solved by an Expert!

Get step-by-step solutions from verified subject matter experts

Step: 2 Unlock
Step: 3 Unlock

Students Have Also Explored These Related General Management Questions!