

Question: QUESTION 1 A media website has tested two different layouts of their mobile page - some visitors were shown one layout, others shown another layout.They
QUESTION 1
A media website has tested two different layouts of their mobile page - some visitors were shown one layout, others shown another layout.They would like to know which layout leads to longer time on their site for visitors.What statistical method would be best to investigate this?
A)A chi-squared test of association
B)A clustered bar chart
C)A two-sample T test
D)A correlation test
QUESTION 2
What would a correlation coefficient of -0.4 between two variables would indicate?
A)A mistake, because correlation coefficients can only be positive
B)A strong negative relationship between the two variables
C)A weak positive relationship between the two variables
D)A moderately weak negative relationship between the two variables
QUESTION 3
Consider the following simple linear regression model between the dependent variable, SALES (reflecting monthly sales, in dollars) and independent variable, ADVERTISING (representing the monthly advertising expenditure, in dollars):
Expected(SALES) = 3800 + 1.5 ADVERTISING.
The value 1.5 in the above regression model represents:
A)The expected sales with no advertising
B)The expected increase in sales for each additional dollar of advertising
C)The ratio of Sales over advertising
D)The proportion of variation in sales explained by advertising
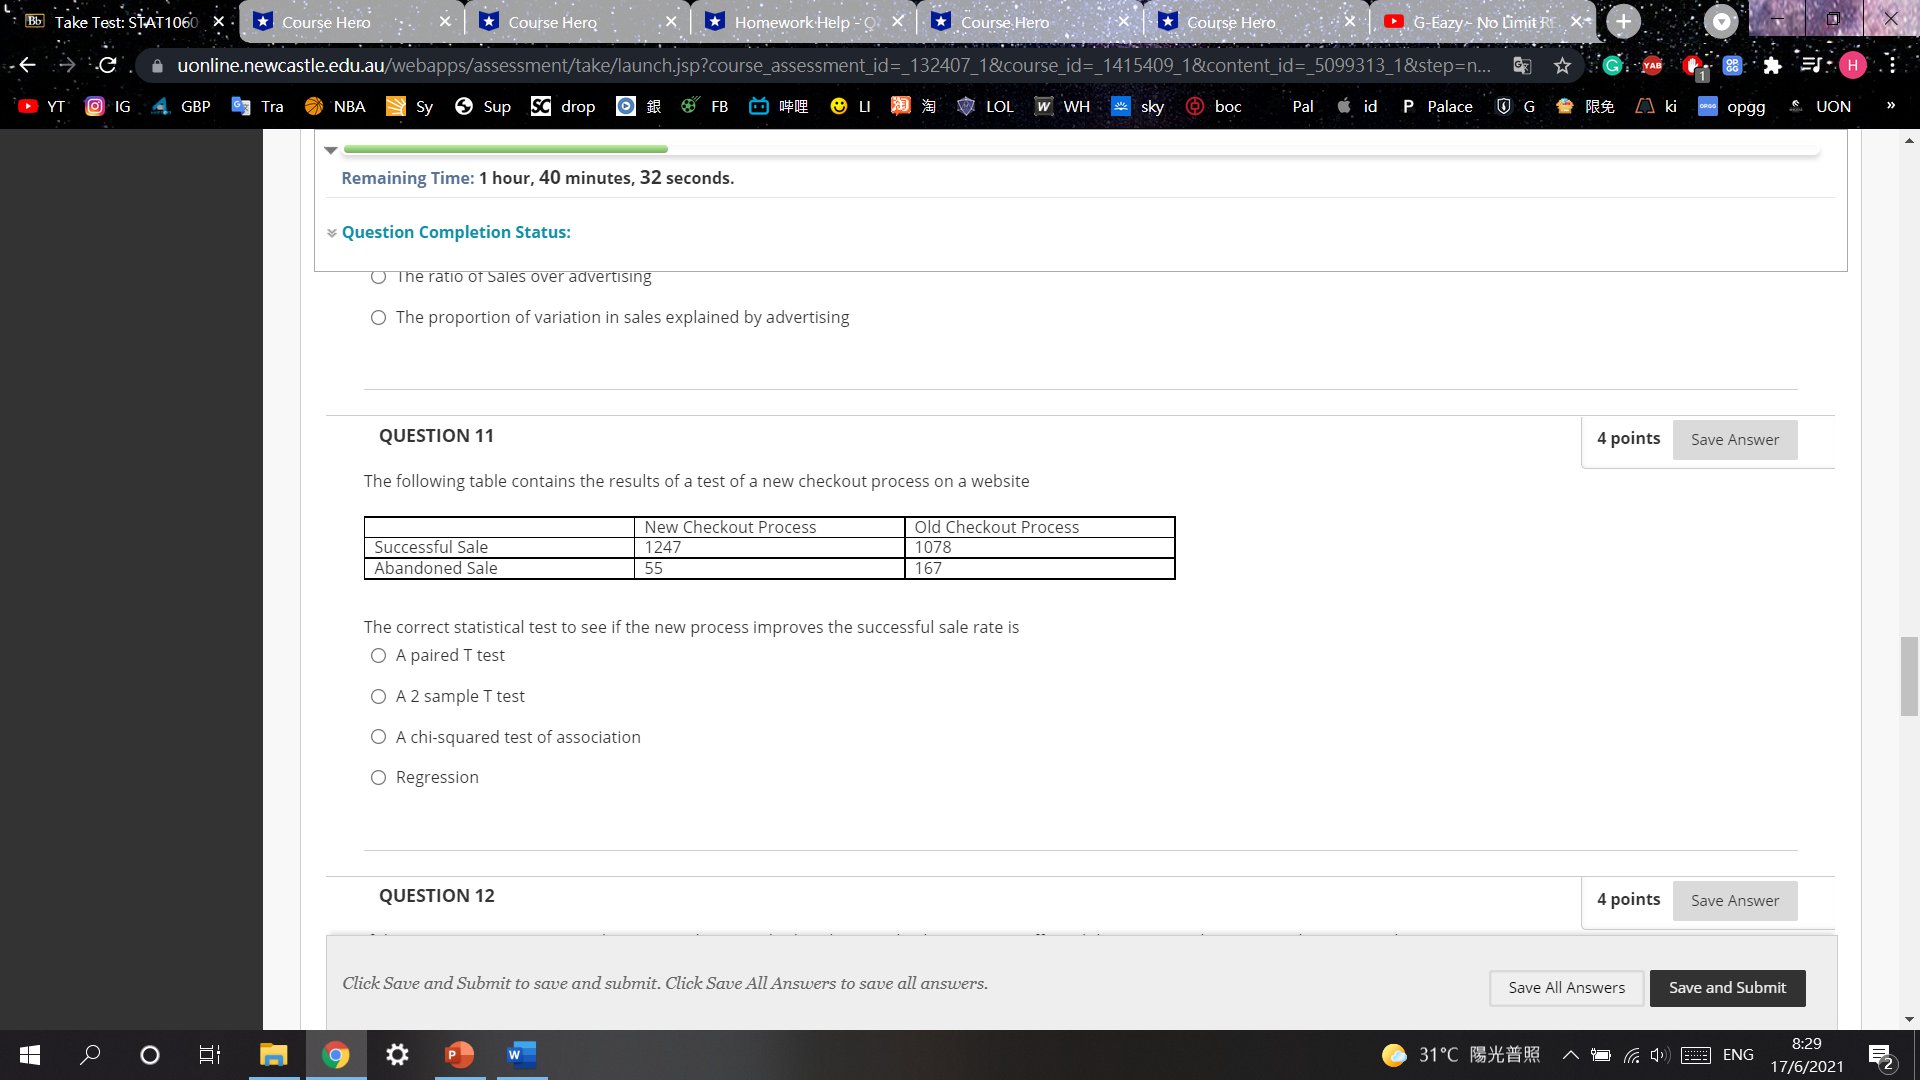
Take Test: STAT1060 X Course Hero *Course Hero *Homework Help - Q. X .Course Hero *Course Hero. Q. G-Eazy - No Limit RE. uonline.newcastle.edu.au/webapps/assessment/take/launch.jsp?course_assessment_id=_132407_1&course_id=_1415409_1&content_id=_5099313_1&step=n... YAB H YTO IG G. A. GBP Tra NBA Sy Sup SC drop @ FB #1: @ LI Q 3 LOL W WH 2 sky @ boc Pal @ id P Palace ki spee opgg & UON Remaining Time: 1 hour, 40 minutes, 32 seconds. Question Completion Status: O The ratio of Sales over advertising O The proportion of variation in sales explained by advertising QUESTION 11 4 points Save Answer The following table contains the results of a test of a new checkout process on a website New Checkout Process Old Checkout Process Successful Sale 1247 1078 Abandoned Sale 55 167 The correct statistical test to see if the new process improves the successful sale rate is O A paired T test O A 2 sample T test O A chi-squared test of association O Regression QUESTION 12 4 points Save Answer Click Save and Submit to save and submit. Click Save All Answers to save all answers. Save All Answers Save and Submit 9 P C 31 C BAR ENG 8:29 17/6/2021
Step by Step Solution
There are 3 Steps involved in it

Get step-by-step solutions from verified subject matter experts