Question: Question 1 Aini is a Quality Engineer in ABC plastic injection company. She is doing a quality inspection on a lot of 60 plastic covers
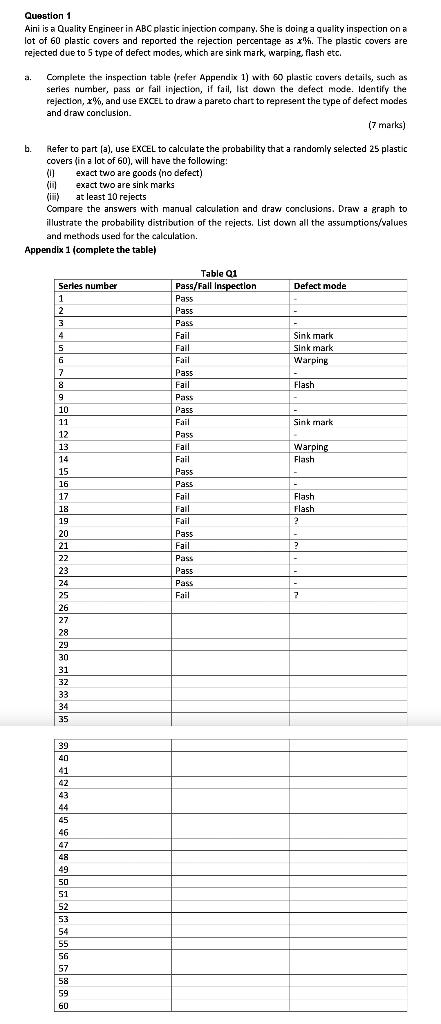
Question 1 Aini is a Quality Engineer in ABC plastic injection company. She is doing a quality inspection on a lot of 60 plastic covers and reported the rejection percentage as x'n. The plastic covers are rejected due to 5 type of defect modes, which are sink mark, warping, flash etc. a. Complete the inspection table (refer Appendix 1) with 60 plastic covers details, such as series number, pass or fail injection, if fail, list down the defect mode. Identify the rejection, 2%, and use EXCEL to draw a pareto chart to represent the type of defect modes and draw conclusion (7 marks) b. Refer to part (a), use EXCEL to calculate the probability that a randomly selected 25 plastic covers in a lot of 60), will have the following: (0) exact two are goods (no defect) (ii exact two are sink marks (iii) at least 10 rejects Compare the answers with manual calculation and draw conclusions. Draw a graph to illustrate the probability distribution of the rejects. List down all the assumptions/values and methods used for the calculation. Appendix 1 (complete the table) Defect mode Serles number 1 Table 1 Pass/Fall Inspection Pass Pass 2 3 Pass - 4 Fail Sink mark 5 Fail Sink mark Warping 6 Fail 7 Pass 8 Fail Flash 9 Pass 10 Pass 11 Fail Sink mark Pass 12 13 Fail Warping Flash 14 Fail 15 Pass 16 Pass Fail Flash 17 18 19 Fail Fail Flash 2 20 Pass 21 Fail 2 ? 22 Pass - 23 Pass - 24 Pass - 25 Fail 7 26 27 28 29 30 31 32 33 34 35 39 40 41 42 43 44 45 46 47 48 49 50 51 52 53 54 55 56 57 58 59 60 Question 1 Aini is a Quality Engineer in ABC plastic injection company. She is doing a quality inspection on a lot of 60 plastic covers and reported the rejection percentage as x'n. The plastic covers are rejected due to 5 type of defect modes, which are sink mark, warping, flash etc. a. Complete the inspection table (refer Appendix 1) with 60 plastic covers details, such as series number, pass or fail injection, if fail, list down the defect mode. Identify the rejection, 2%, and use EXCEL to draw a pareto chart to represent the type of defect modes and draw conclusion (7 marks) b. Refer to part (a), use EXCEL to calculate the probability that a randomly selected 25 plastic covers in a lot of 60), will have the following: (0) exact two are goods (no defect) (ii exact two are sink marks (iii) at least 10 rejects Compare the answers with manual calculation and draw conclusions. Draw a graph to illustrate the probability distribution of the rejects. List down all the assumptions/values and methods used for the calculation. Appendix 1 (complete the table) Defect mode Serles number 1 Table 1 Pass/Fall Inspection Pass Pass 2 3 Pass - 4 Fail Sink mark 5 Fail Sink mark Warping 6 Fail 7 Pass 8 Fail Flash 9 Pass 10 Pass 11 Fail Sink mark Pass 12 13 Fail Warping Flash 14 Fail 15 Pass 16 Pass Fail Flash 17 18 19 Fail Fail Flash 2 20 Pass 21 Fail 2 ? 22 Pass - 23 Pass - 24 Pass - 25 Fail 7 26 27 28 29 30 31 32 33 34 35 39 40 41 42 43 44 45 46 47 48 49 50 51 52 53 54 55 56 57 58 59 60


