

Question: Question 1 and 2 please. Thank you table [ [ Mix 1 ] , [ Mass ( g ) , Compress ( psi ) ,
Question and please. Thank you
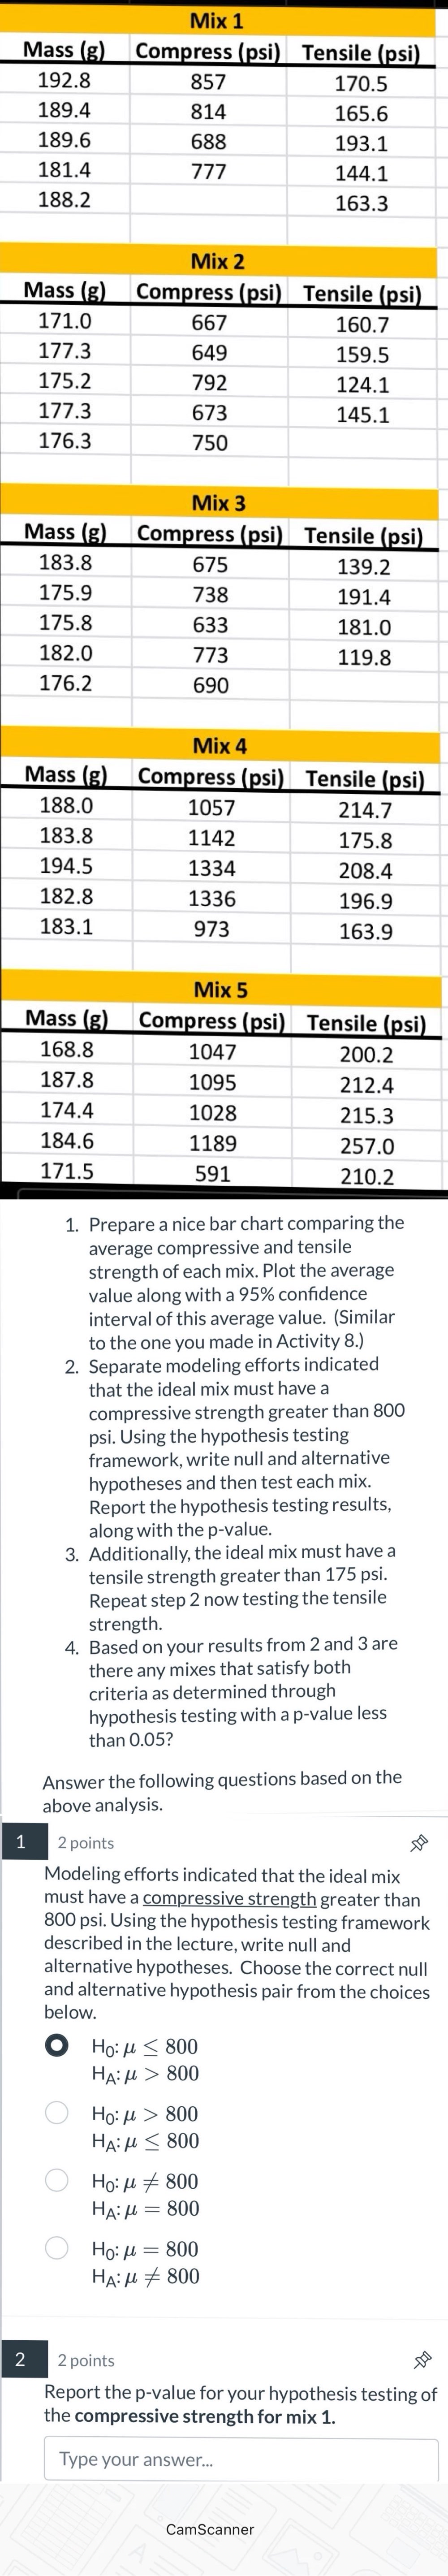
tableMix Mass gCompress psiTensile psiMix Mass gCompress psiTensile psiMix Mass gCompress psiTensile psiMix Mass gCompress psiTensile psiMix Mass gCompress psiTensile psi
Prepare a nice bar chart comparing the average compressive and tensile strength of each mix. Plot the average value along with a confidence interval of this average value. Similar to the one you made in Activity
Separate modeling efforts indicated that the ideal mix must have a compressive strength greater than psi. Using the hypothesis testing framework, write null and alternative hypotheses and then test each mix. Report the hypothesis testing results, along with the value.
Additionally, the ideal mix must have a tensile strength greater than Repeat step now testing the tensile strength
Based on your results from and are there any mixes that satisfy both criteria as determined through hypothesis testing with a value less than
Answer the following questions based on the above analysis
points
Modeling efforts indicated that the ideal mix must have a compressive strength greater than Using the hypothesis testing framework described in the lecture, write null and alternative hypotheses. Choose the correct null and alternative hypothesis pair from the choices below.
:
:
:
:
:
:
:
:
points
Report the pvalue for your hypothesis testing of the compressive strength for mix
Type your answer.
CamScanne
Step by Step Solution
There are 3 Steps involved in it
1 Expert Approved Answer
Step: 1 Unlock

Question Has Been Solved by an Expert!
Get step-by-step solutions from verified subject matter experts
Step: 2 Unlock
Step: 3 Unlock