

Question: question 1 Assume that the differences are normally distributed. Complete parts (a) through (d) below. Observation 1 2 3 4 5 6 7 E X
question 1
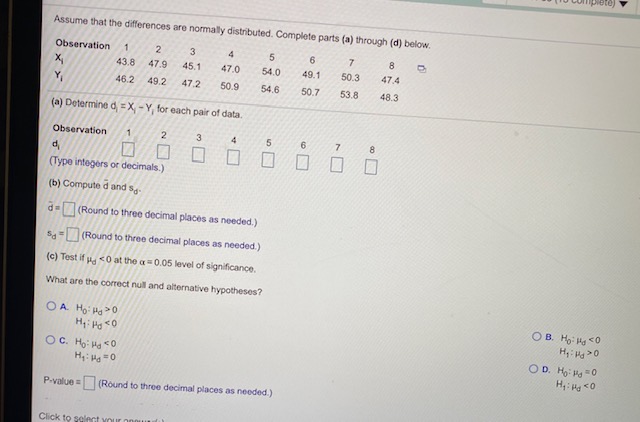
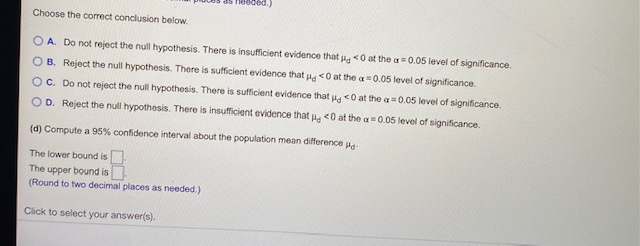
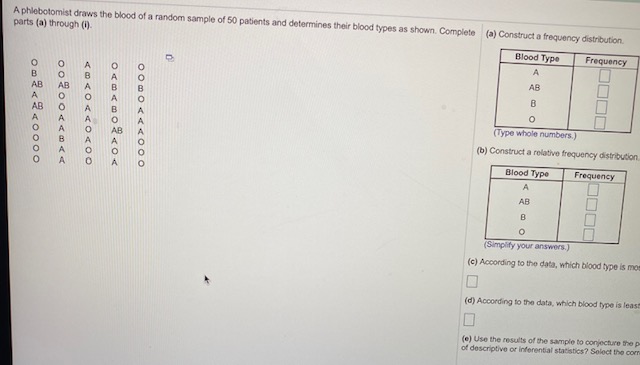
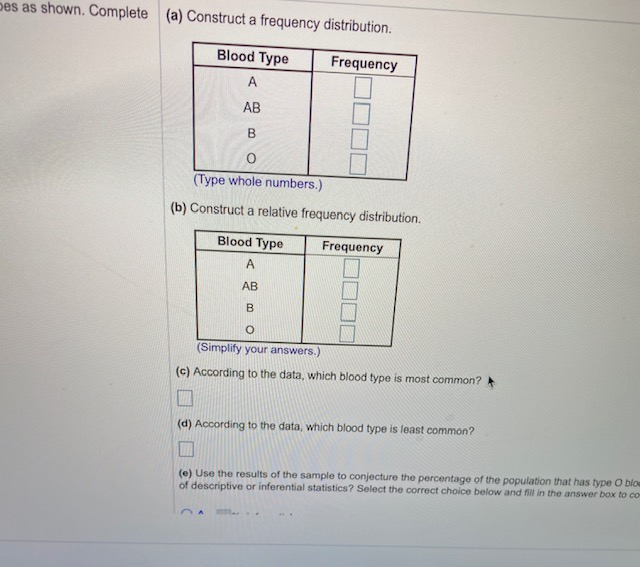
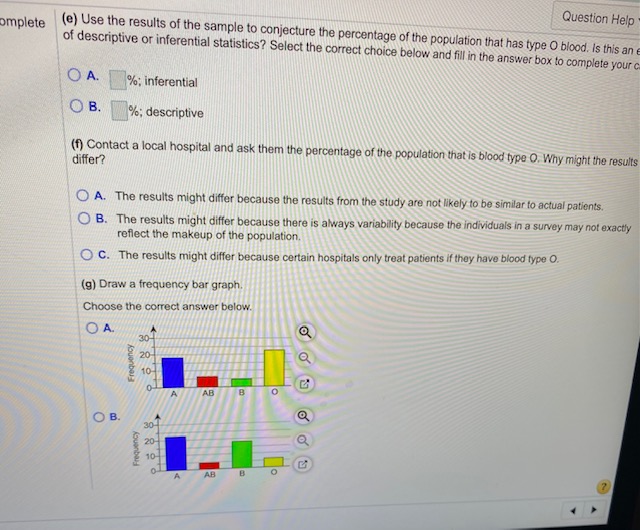
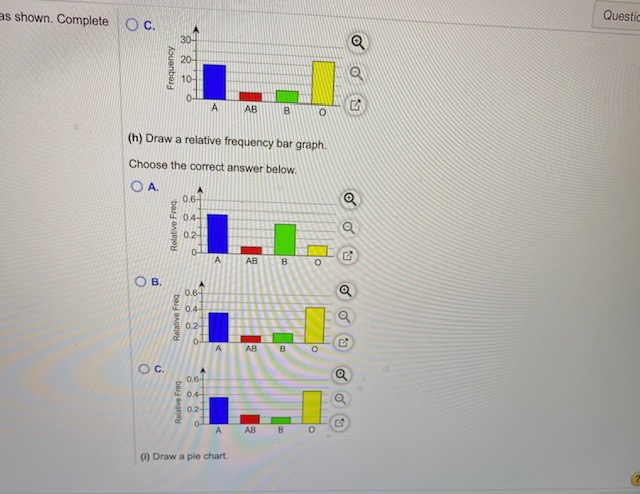
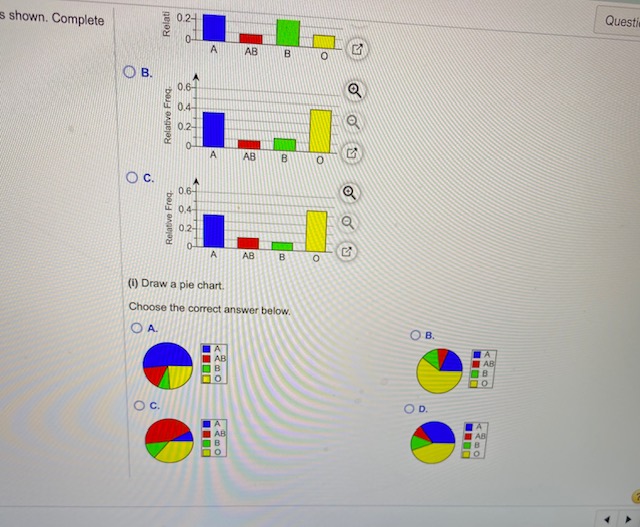
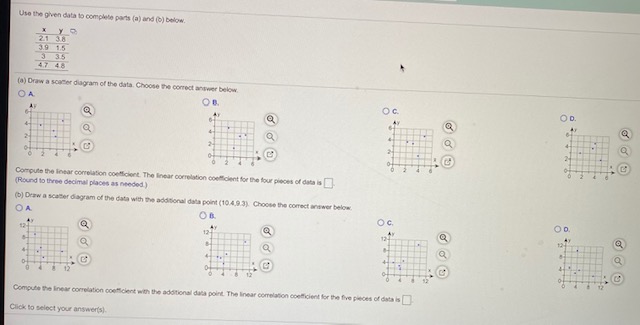
Assume that the differences are normally distributed. Complete parts (a) through (d) below. Observation 1 2 3 4 5 6 7 E X 43.8 47.9 45.1 47.0 54.0 49.1 50.3 474 46.2 49.2 47.2 50.9 54.6 50.7 53.8 48.3 (a) Determine d = X - Y for each pair of data. Observation 4 5 6 7 8 d (Typo integers or decimals.) (b) Compute d and sa a = (Round to three decimal places as needed.) sy =(Round to three decimal places as needed.) (c) Test if u. 0 O B. Ho: Ha $0 O C. Hoi Ha *0 OD. Ho: Py =0 Hy: Ha = 0 P-value = (Round to three decimal places as needed.) Click to solpetChoose the correct conclusion below. O A. Do not reject the null hypothesis. There is insufficient evidence that py > >0800 (Type whole numbers.} (b) Construct a relative frequency distribution Blood Type Frequency A AR B O (Simplify your answers.] (c) According to the data, which blood type is ma () According to the data, which blood type is least (e) Use the results of the sample to conjecture the p of descriptive of Inferential statistics? Sofget the comes as shown. Complete (a) Construct a frequency distribution. Blood Type Frequency A AB B O (Type whole numbers.) (b) Construct a relative frequency distribution. Blood Type Frequency A AB B O (Simplify your answers.) (c) According to the data, which blood type is most common? (d) According to the data, which blood type is least common? (e) Use the results of the sample to conjecture the percentage of the population that has type O bio of descriptive or inferential statistics? Select the correct choice below and fill in the answer box to coQuestion Help omplete (e) Use the results of the sample to conjecture the percentage of the population that has type O blood. Is this an of descriptive or inferential statistics? Select the correct choice below and fill in the answer box to complete your c O A. %; inferential OB. %; descriptive (f) Contact a local hospital and ask them the percentage of the population that is blood type O. Why might the results differ? O A. The results might differ because the results from the study are not likely to be similar to actual patients. O B. The results might differ because there is always variability because the individuals in a survey may not exactly reflect the makeup of the population. O C. The results might differ because certain hospitals only treat patients if they have blood type O. (g) Draw a frequency bar graph. Choose the correct answer below. O A. 30 20 Frequency 10 A AB O B. 30 20 Frequency 10 AHQuestic as shown. Complete O C. 30-J 20- Frequency 10- A AB B O (h) Draw a relative frequency bar graph. Choose the correct answer below. OA. 0.6 0.4- Relat vo Frog. 0.2- A AB O B 0.6 0.4- Rolativo Frog 0.2- A AH B O c. 0.4- 0.2- A AH H (i) Draw a ple chartQuesti shown. Complete 0.2- Rolati A AB B O O B. 0.6- 0.4 Relative Frog 0.2- A AB B O c. 0.6- 0.4- Relative Frog 0.2- A AB B (1) Draw a pie chart. Choose the correct answer below. OA. O B. A A AB AB OC. OD. A I AB AB BWin the given data to complete parts (a) and (o) below. 309 1.5 47 48 (a) Draw a scover diagram of the data. Choose The conpot answer baker. OA OG OD. Q Compute the linear correlation copticdont. The Incar correlation coo client for the four pieces of dats is ET (Round to three decimal places as needed ) (5] Drew a scaber diagram of the data with The additional doin point (104.8.3). Choose the correct order below. DA Compute the Inear correlation poodledent with the additional data point. The Inear compilation confident for the five pieces of data is I Click to select your answers)
Step by Step Solution
There are 3 Steps involved in it

Get step-by-step solutions from verified subject matter experts