

Question: Question 1 ( b ) ( i ) The runoff data measured following a 3 - hour storm are given in Table Q 1 .
Question
b
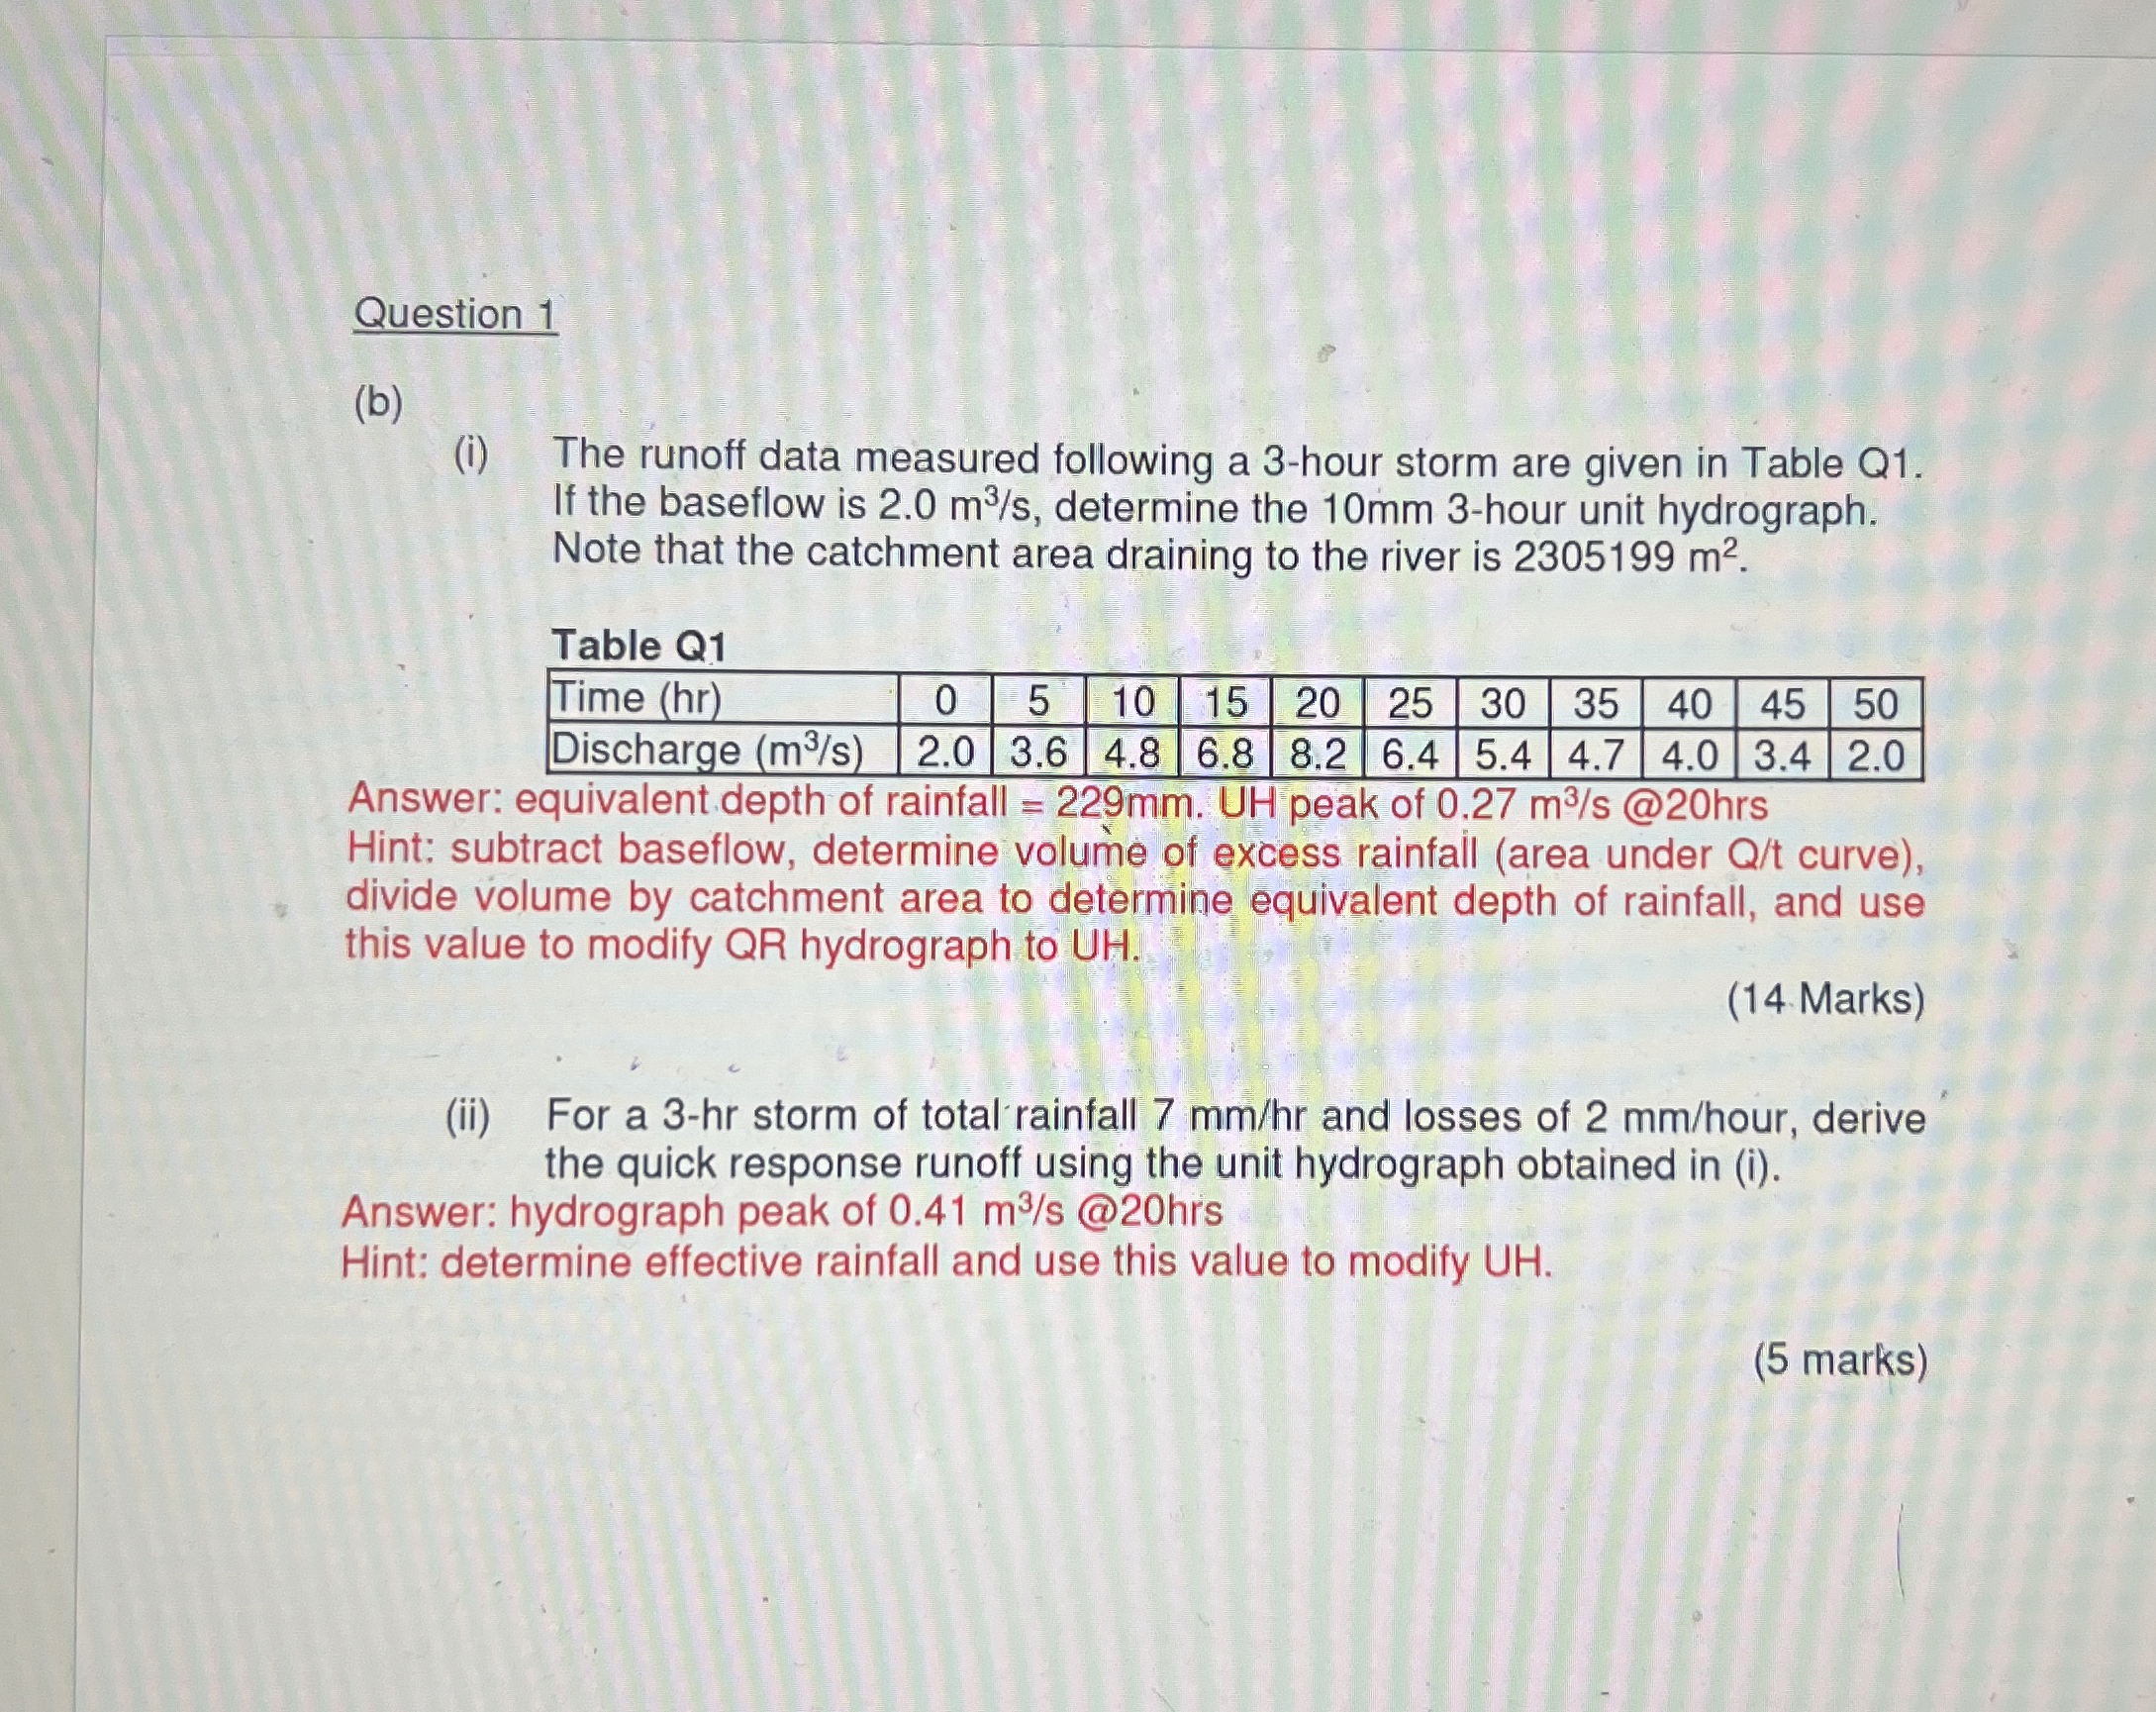
i The runoff data measured following a hour storm are given in Table Q If the baseflow is determine the mm hour unit hydrograph. Note that the catchment area draining to the river is
Table Q
tableTime Discharge
Answer: equivalent depth of rainfall UH peak of @ Hint: subtract baseflow, determine volume of excess rainfail area under Qt curve divide volume by catchment area to determine equivalent depth of rainfall, and use this value to modify QR hydrograph to UH
Marks
ii For a hr storm of total rainfall and losses of hour, derive the quick response runoff using the unit hydrograph obtained in i
Answer: hydrograph peak of @
Hint: determine effective rainfall and use this value to modify UH
marks
Step by Step Solution
There are 3 Steps involved in it
1 Expert Approved Answer
Step: 1 Unlock

Question Has Been Solved by an Expert!
Get step-by-step solutions from verified subject matter experts
Step: 2 Unlock
Step: 3 Unlock