Question: Question 1 Based on the table below, calculate Return on Equity Current Assets $1,550 Total Assets $2,100 Operating Prot $600 Debt $875 Net Income $340
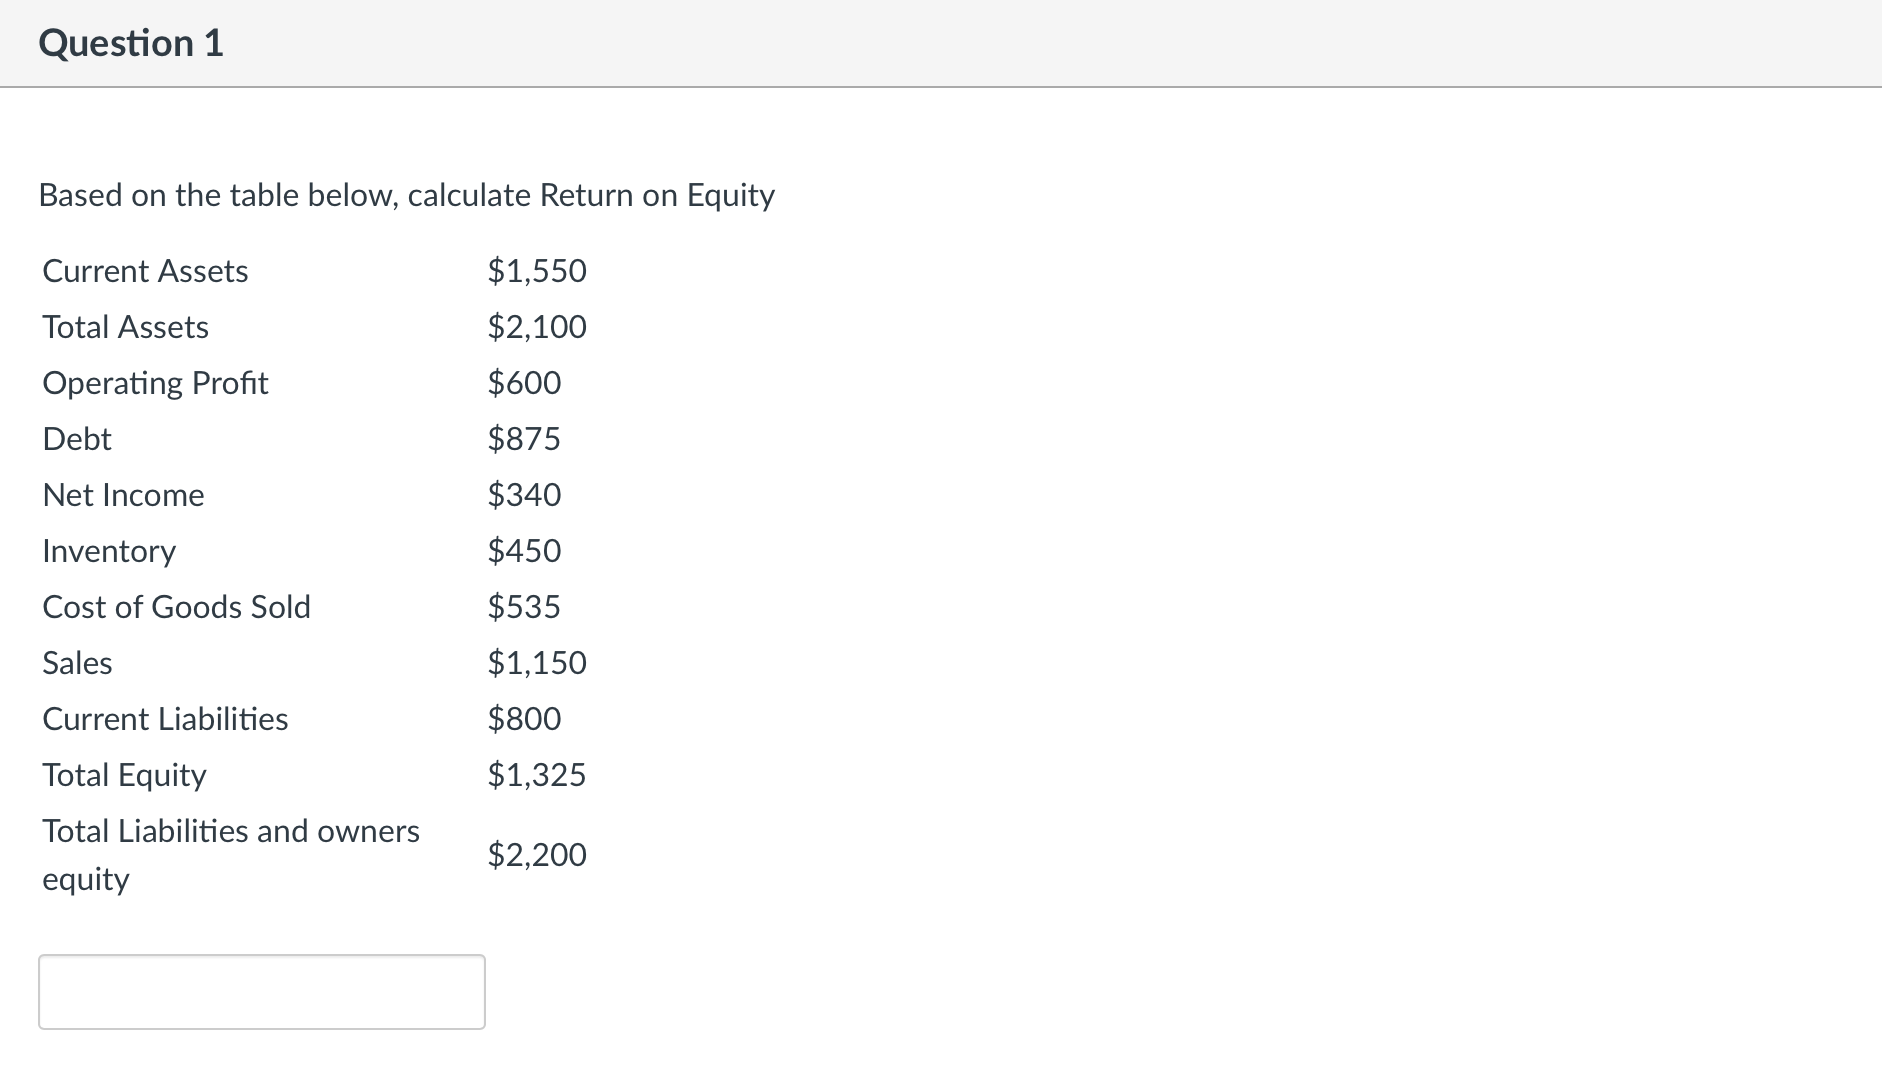
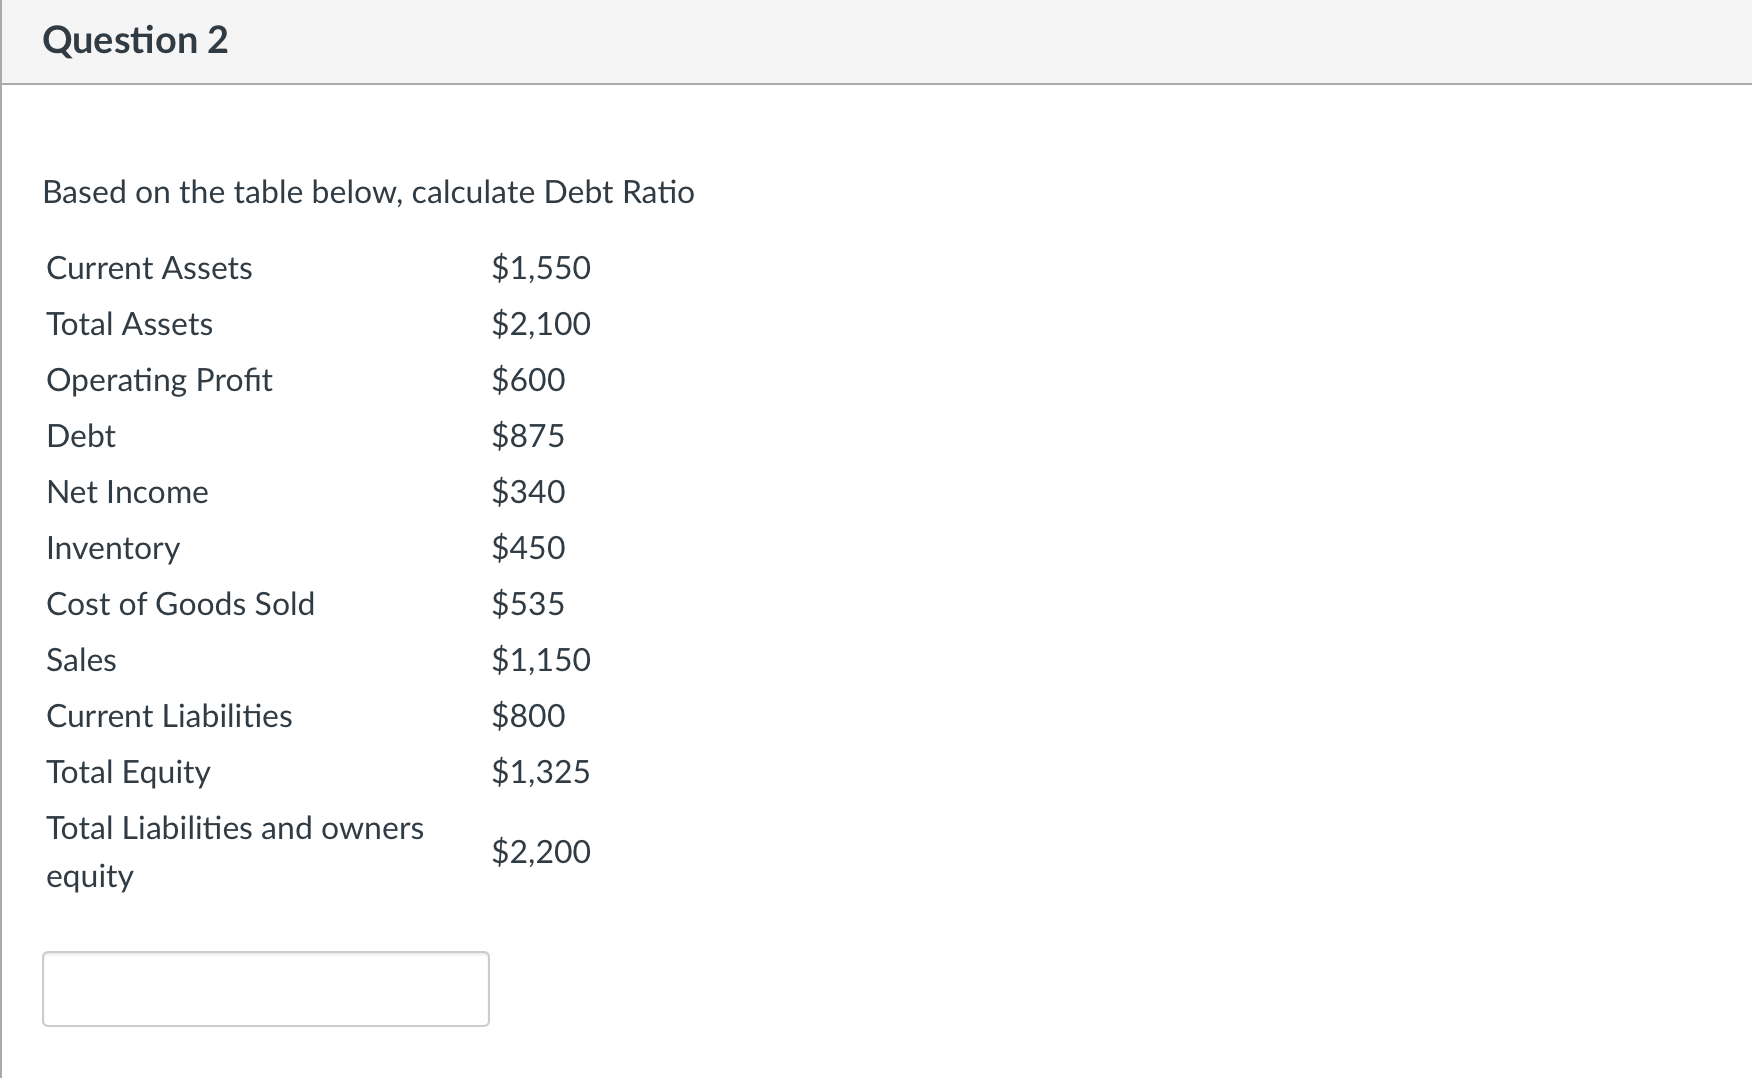
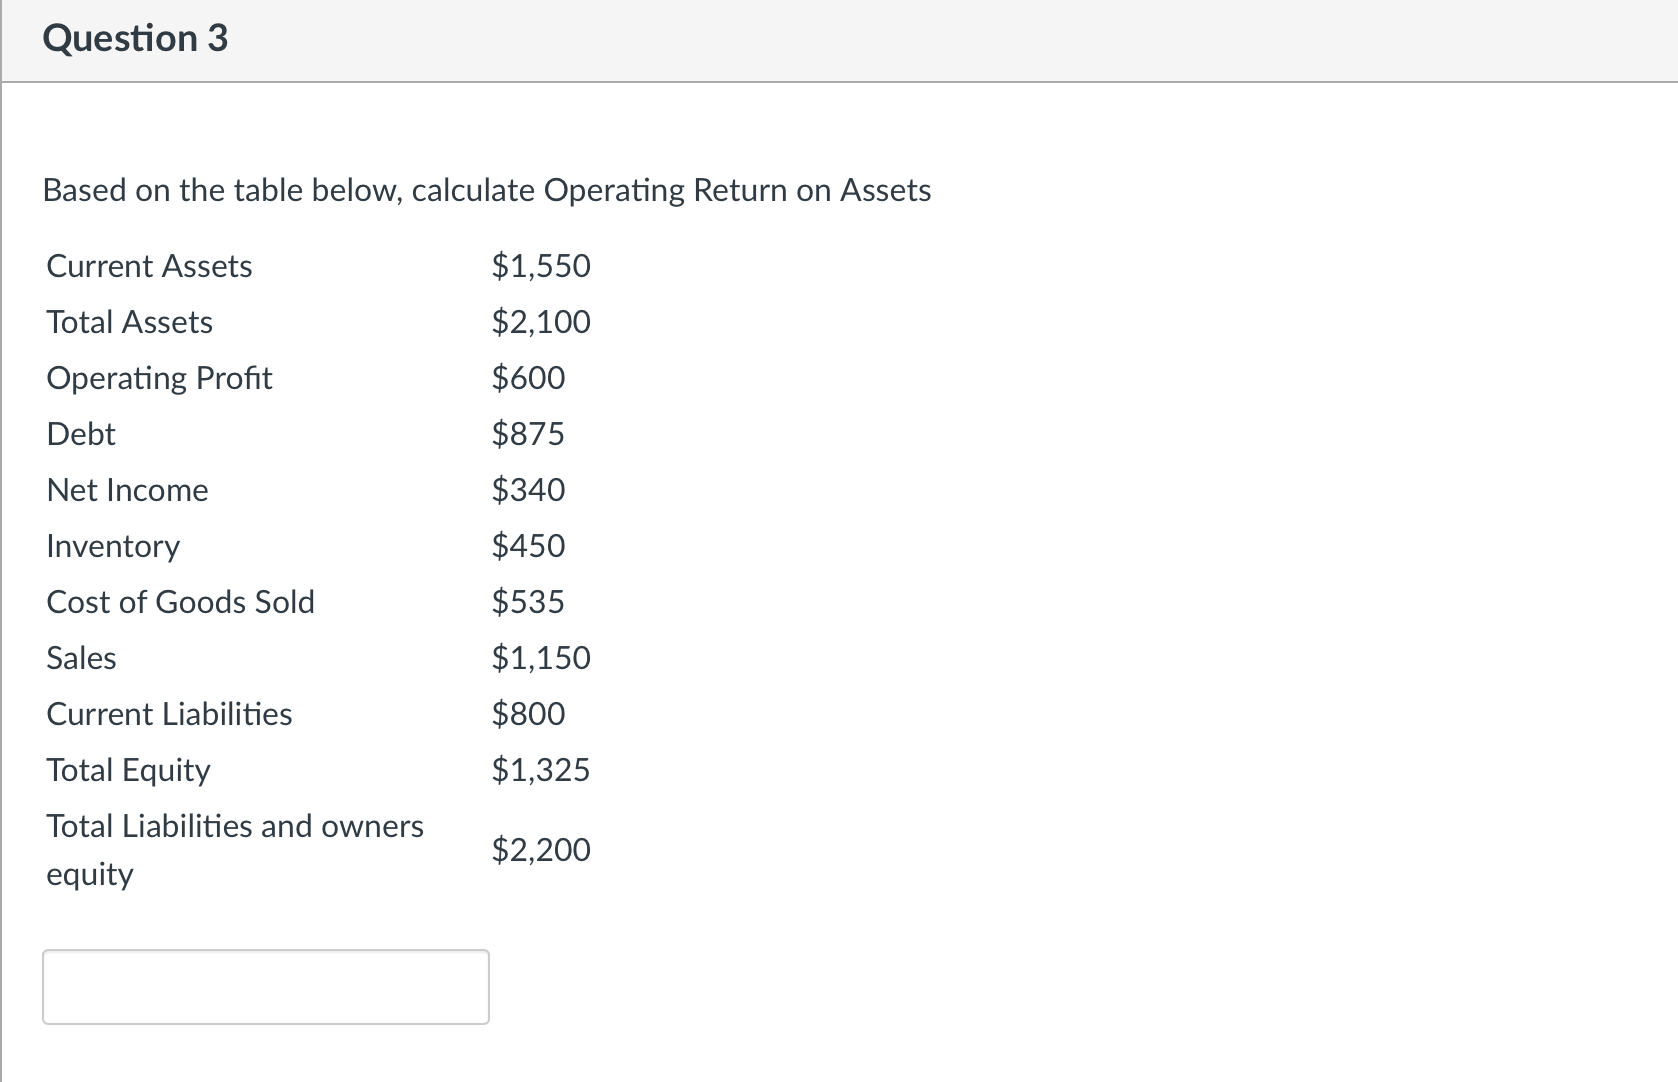
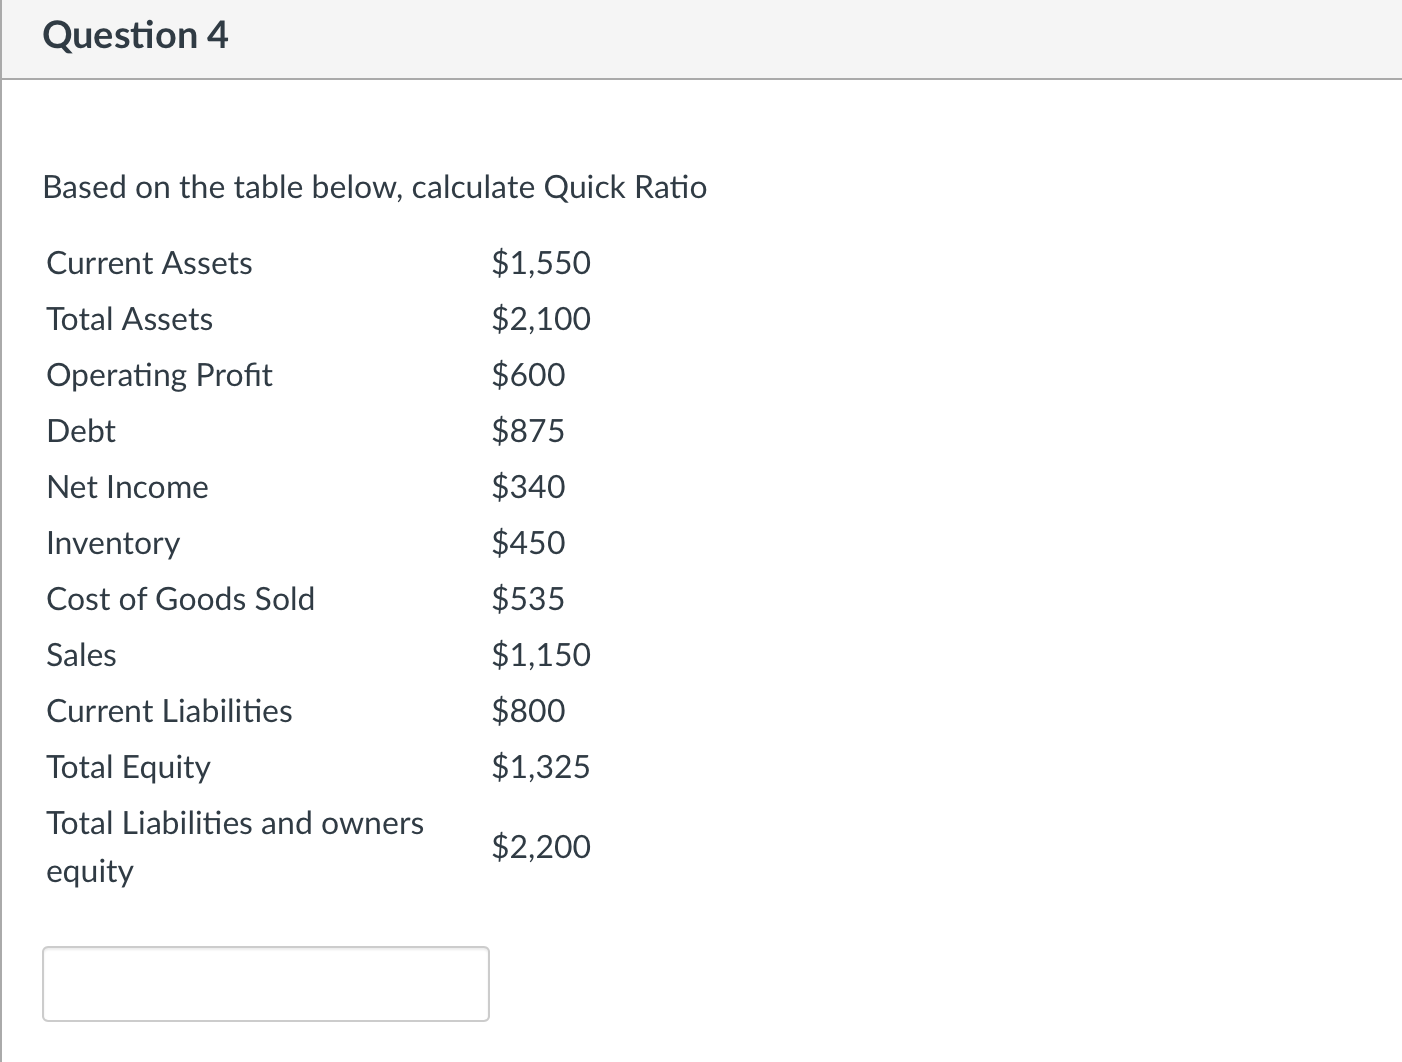
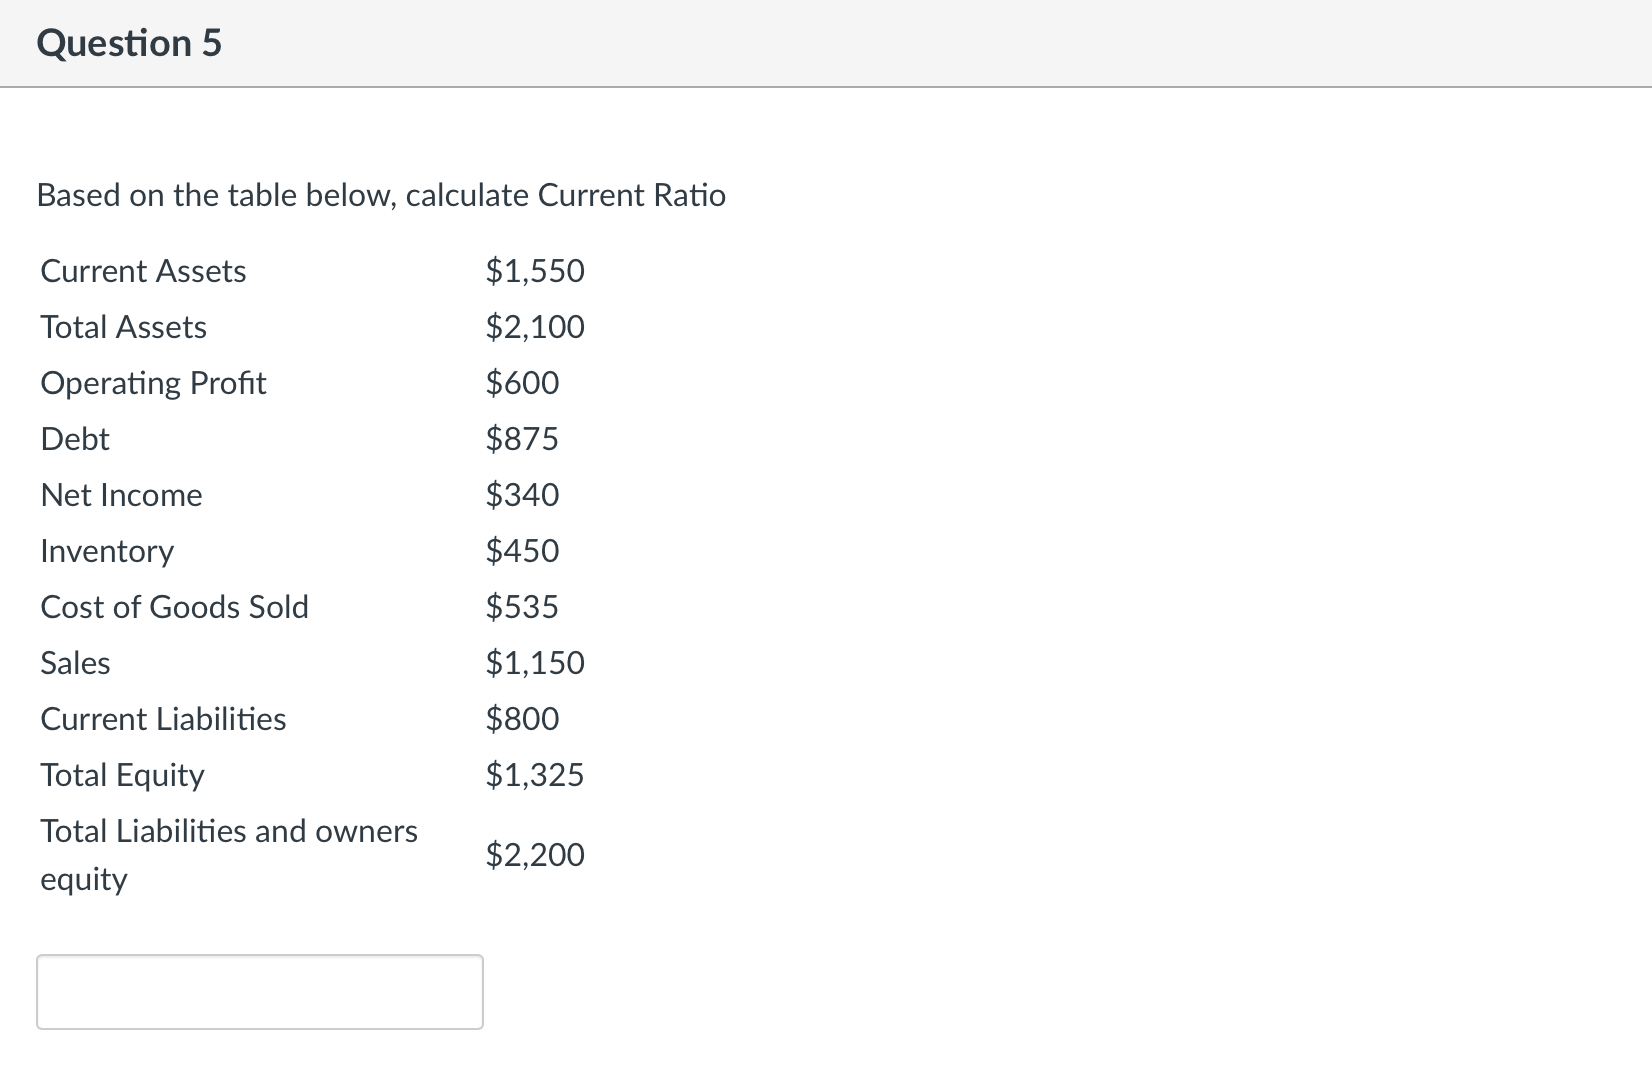
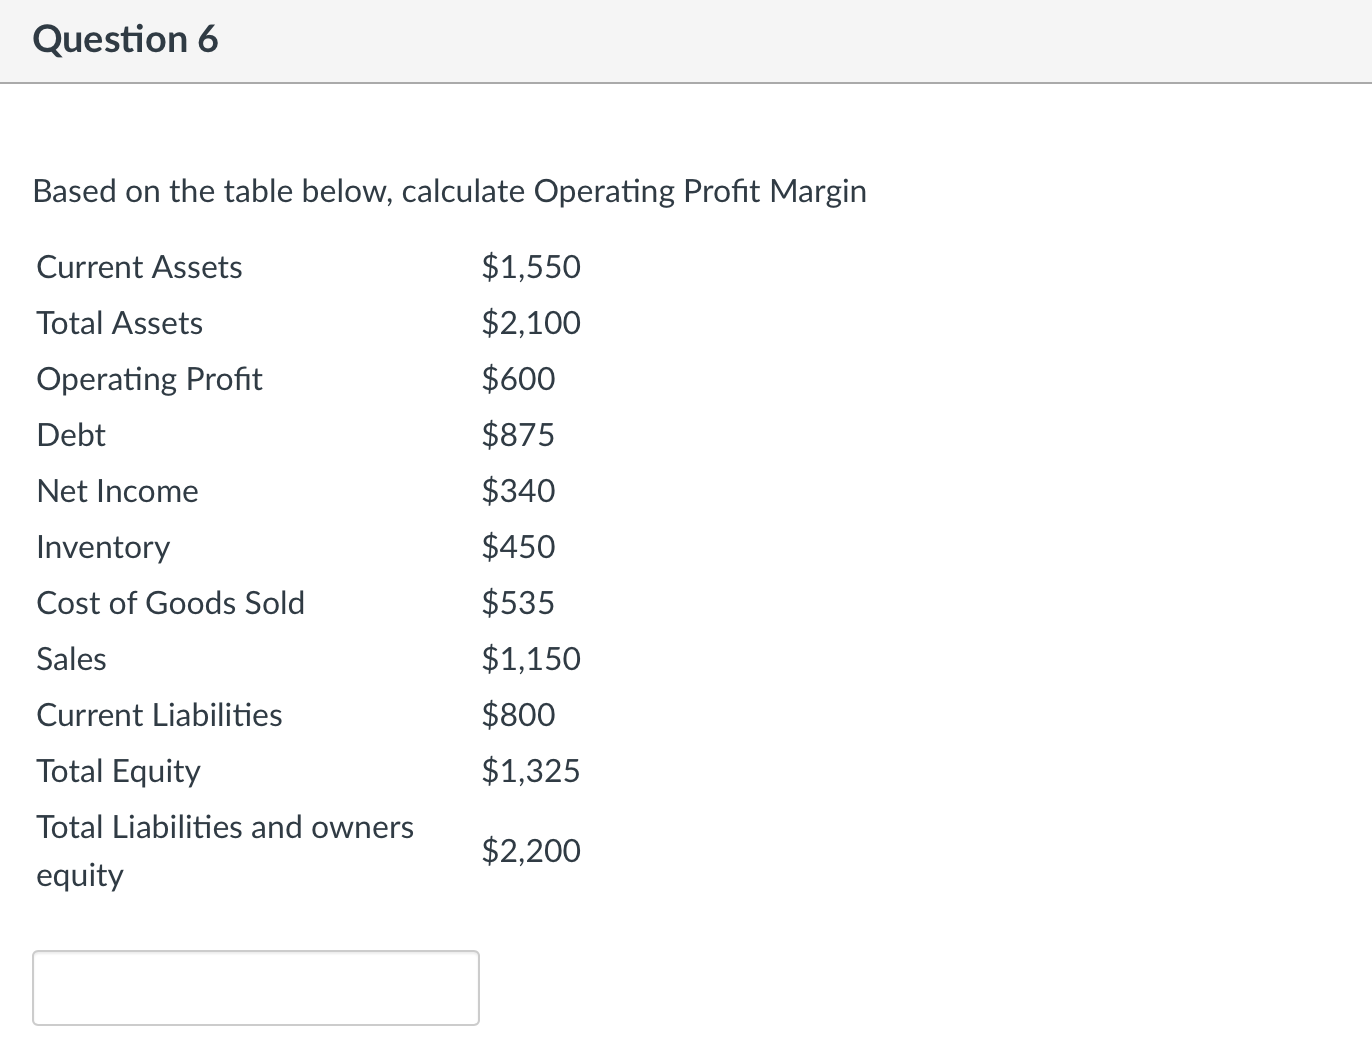
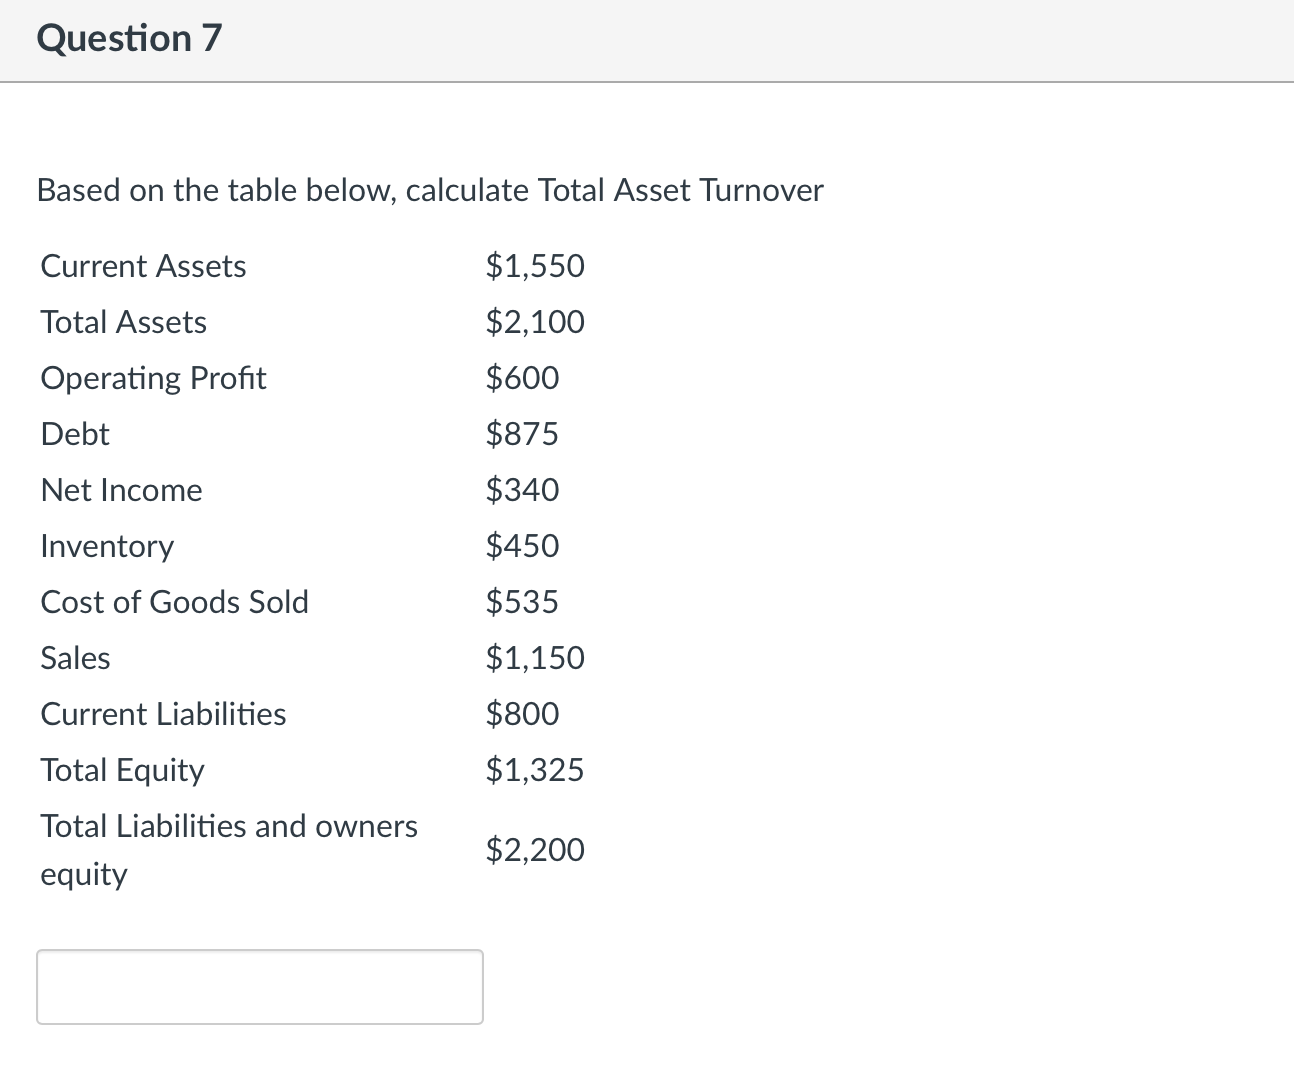
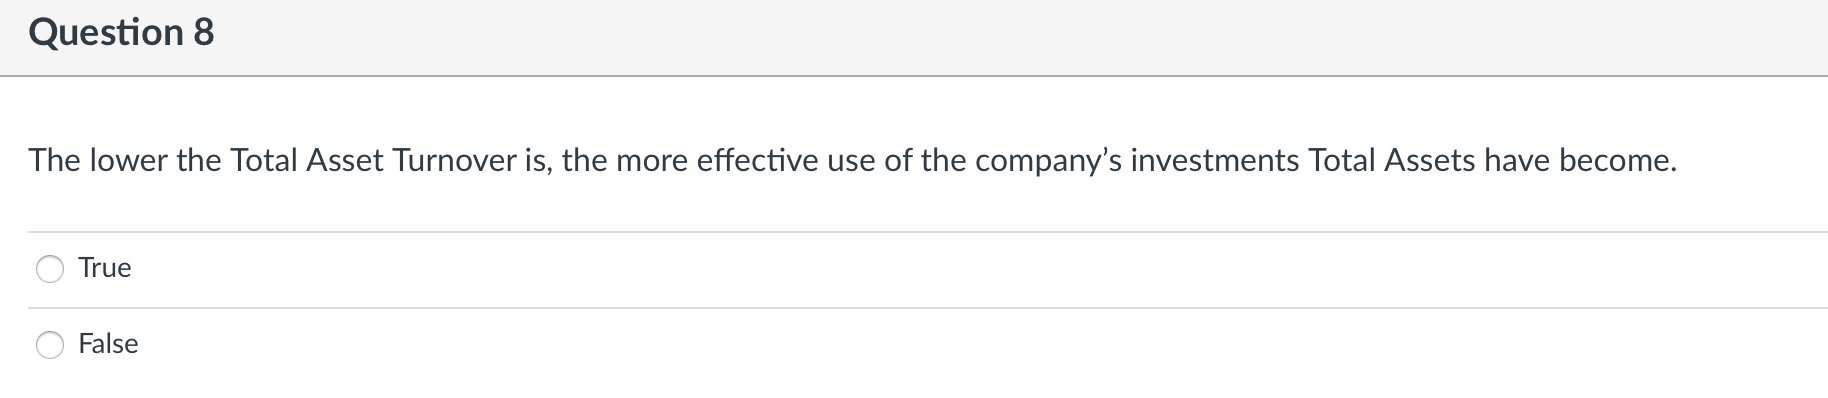
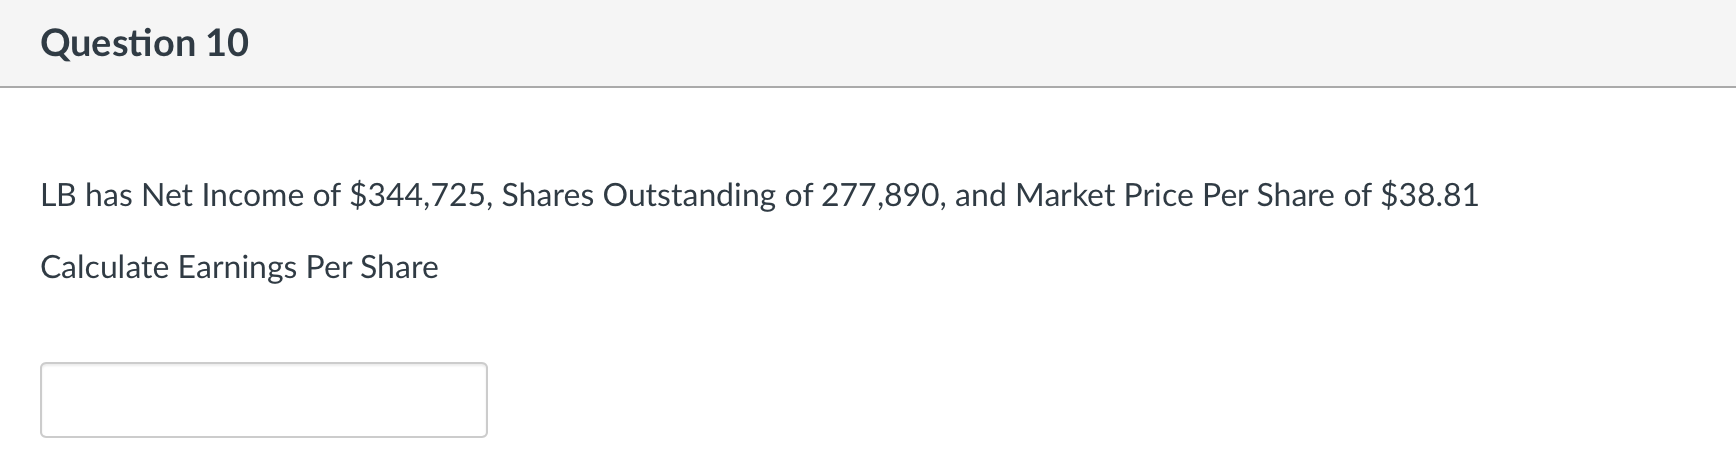
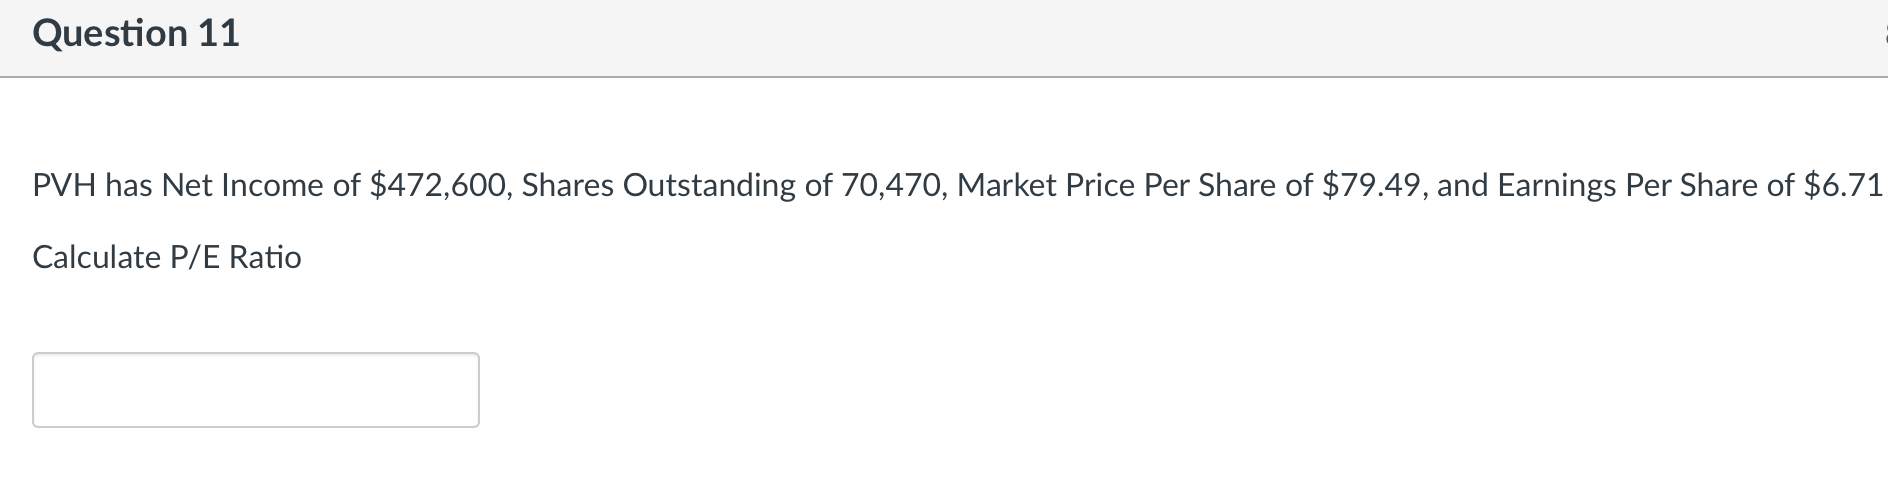
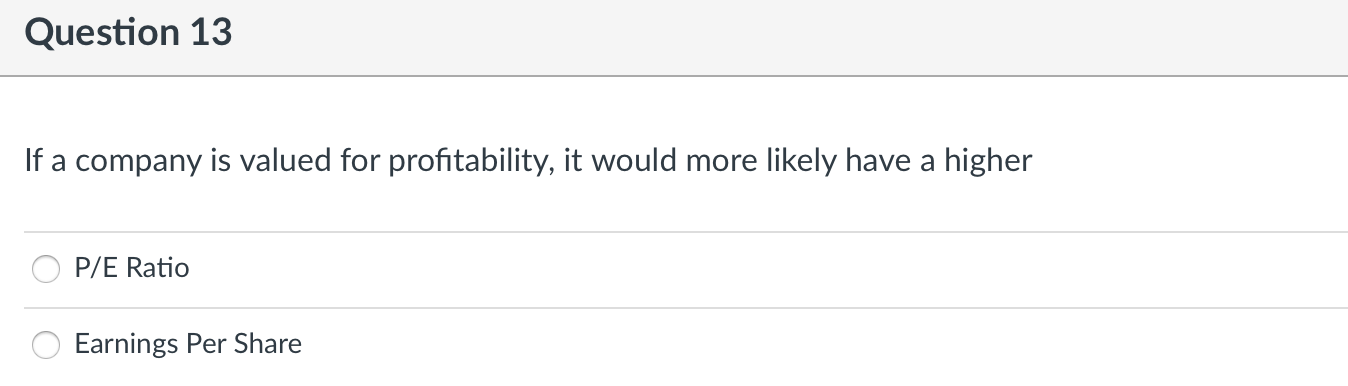
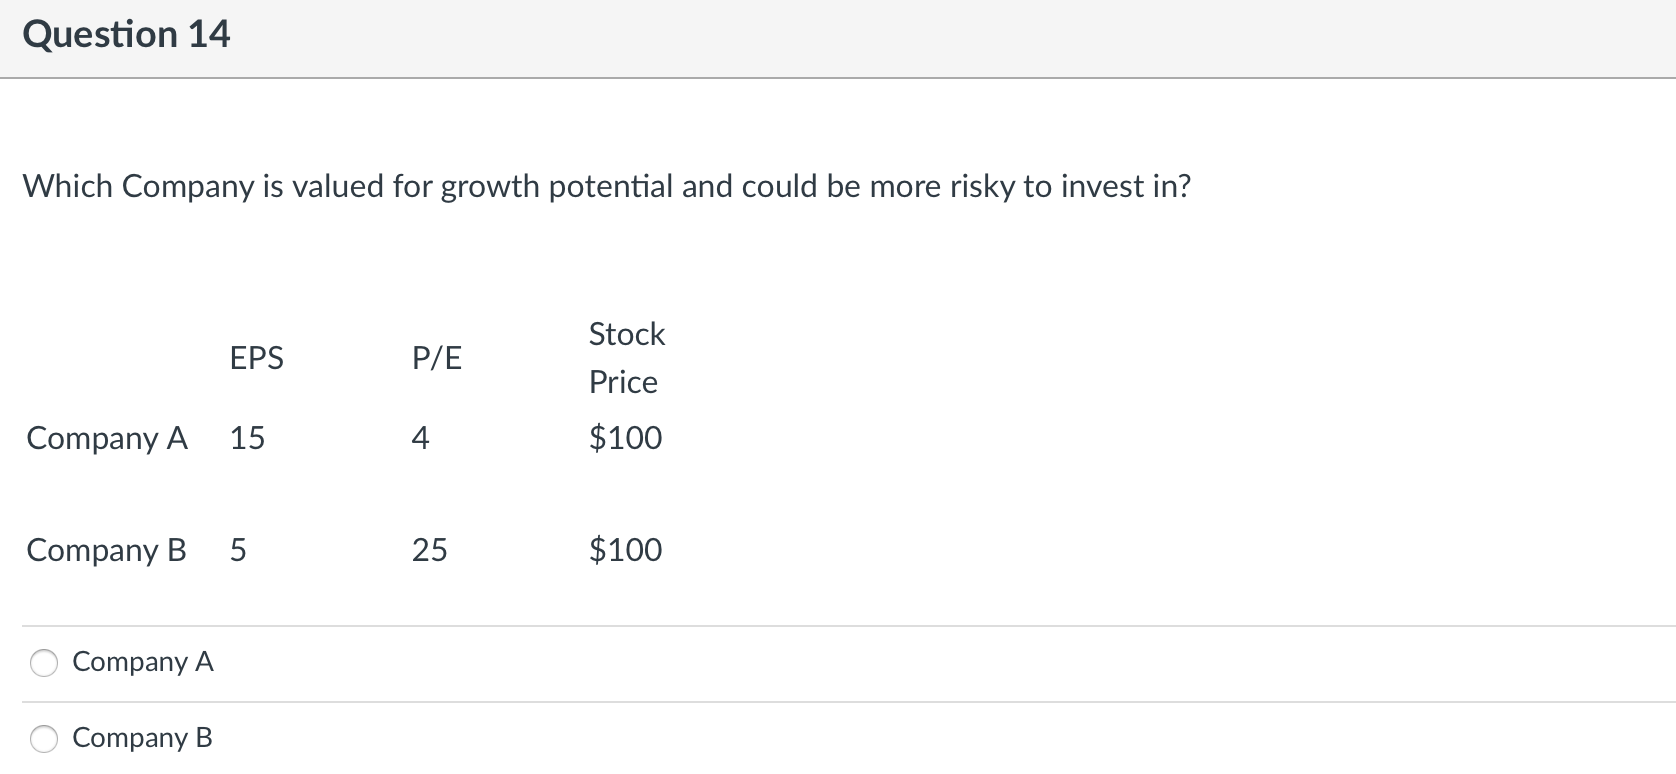
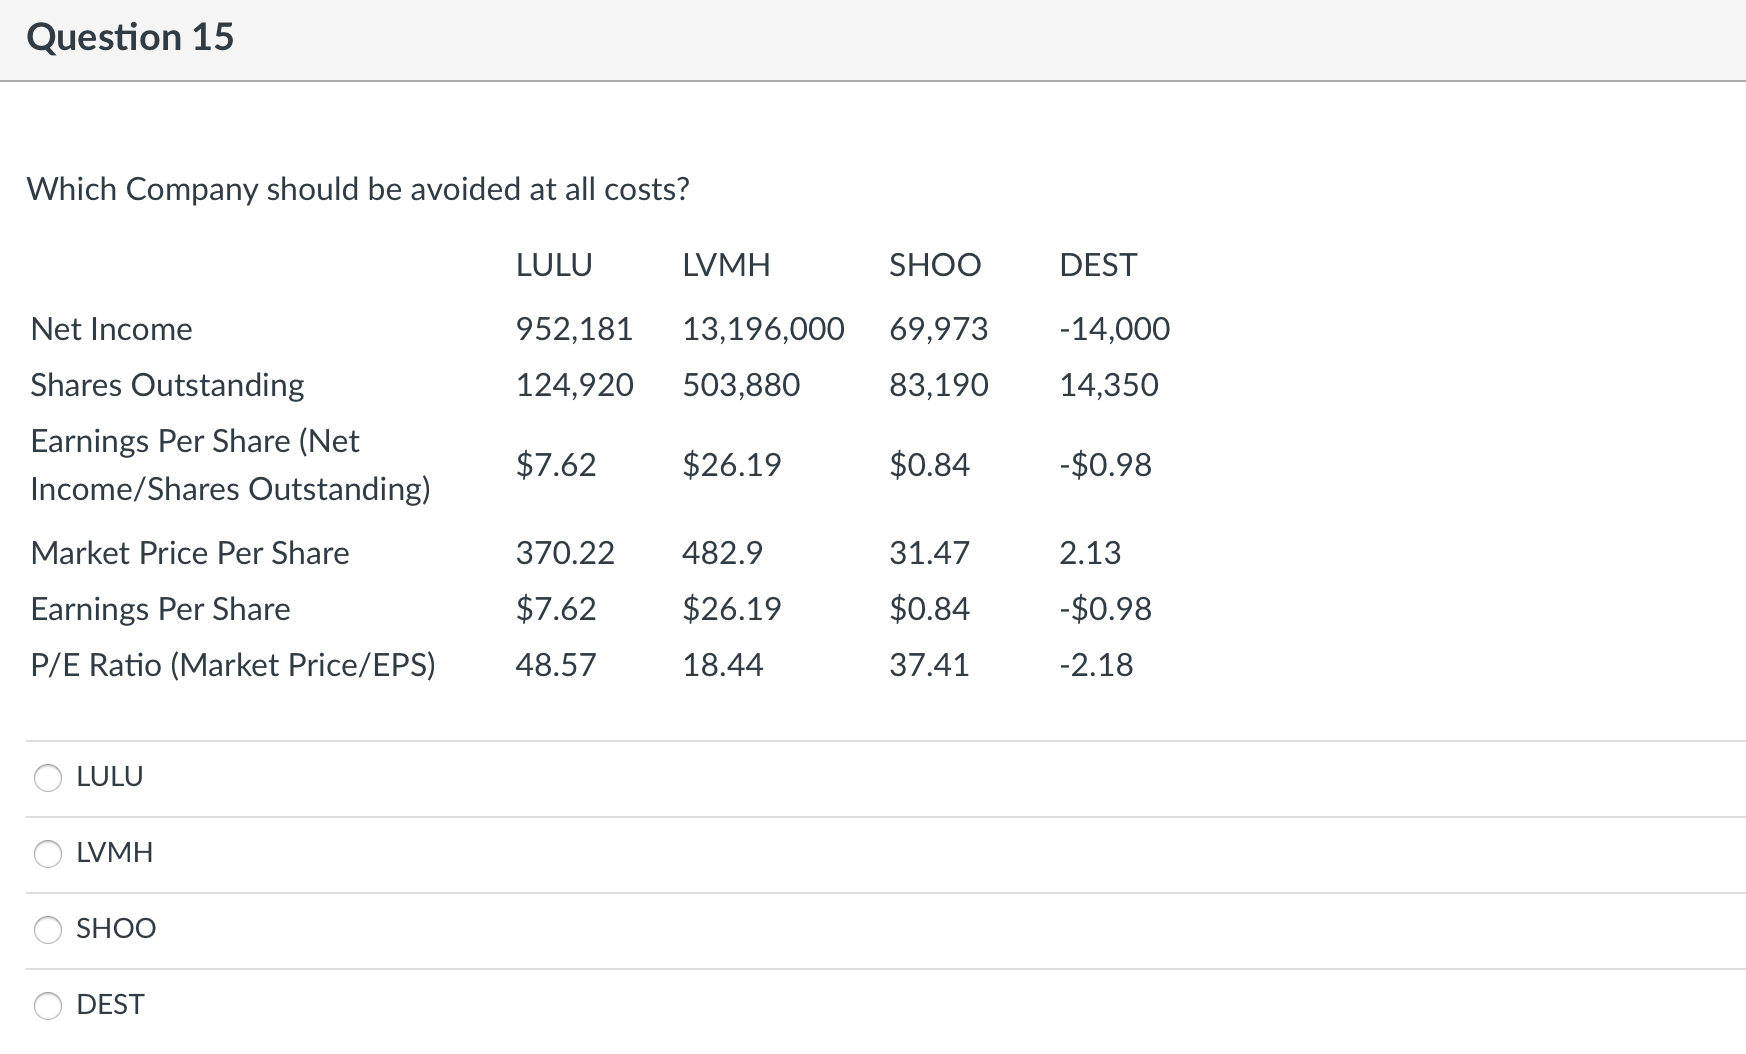
Question 1 Based on the table below, calculate Return on Equity Current Assets $1,550 Total Assets $2,100 Operating Prot $600 Debt $875 Net Income $340 Inventory $450 Cost of Goods Sold $535 Sales $1,150 Current Liabilities $800 Total Equity $1,325 Total Liabilities and owners . $2,200 eqUIty Question 2 Based on the table below, calculate Debt Ratio Current Assets $1,550 Total Assets $2,100 Operating Profit $600 Debt $875 Net Income $340 Inventory $450 Cost of Goods Sold $535 Sales $1,150 Current Liabilities $800 Total Equity $1,325 Total Liabilities and owners $2,200 equityQuestion 3 Based on the table below, calculate Operating Return on Assets Current Assets $1,550 Total Assets $2,100 Operating Prot $600 Debt $875 Net Income $340 Inventory $450 Cost of Goods Sold $535 Sales $1,150 Current Liabilities $800 Total Equity $1,325 Total Liabilities and owners . $2,200 equnty Question 4 Based on the table below, calculate Quick Ratio Current Assets $1,550 Total Assets $2,100 Operating Prot $600 Debt $875 Net Income $340 Inventory $450 Cost of Goods Sold $535 Sales $1,150 Current Liabilities $800 Total Equity $1,325 Total Liabilities and owners . $2,200 eqUIty Question 5 Based on the table below, calculate Current Ratio Current Assets $1,550 Total Assets $2,100 Operating Profit $600 Debt $875 Net Income $340 Inventory $450 Cost of Goods Sold $535 Sales $1,150 Current Liabilities $800 Total Equity $1,325 Total Liabilities and owners $2,200 equityQuestion 6 Based on the table below, calculate Operating Prot Margin Current Assets $1,550 Total Assets $2,100 Operating Prot $600 Debt $875 Net Income $340 Inventory $450 Cost of Goods Sold $535 Sales $1,150 Current Liabilities $800 Total Equity $1,325 Total Liabilities and owners , $2,200 eqUIty Question 7 Based on the table below, calculate Total Asset Turnover Current Assets $1,550 Total Assets $2,100 Operating Prot $600 Debt $875 Net Income $340 Inventory $450 Cost of Goods Sold $535 Sales $1,150 Current Liabilities $800 Total Equity $1,325 Total Liabilities and owners , $2,200 equmy Question 8 The lower the Total Asset Turnover is, the more effective use of the company's investments Total Assets have become. 0 True C False Question 9 High Inventory Turnover implies weak sales and, excess inventory. 0 True 0 False Question 10 LB has Net Income of $344,725, Shares Outstanding of 277,890, and Market Price Per Share of $38.81 Calculate Earnings Per Share Question 11 PVH has Net Income of $472,600, Shares Outstanding of 70,470, Market Price Per Share of $79.49, and Earnings Per Share of $6.71 Calculate P/E Ratio Question 12 If a company is valued for potential growth, it would more likely have a higher 0 P/ E Ratio 0 Earnings Per Share Question 13 If a company is valued for profitability, it would more likely have a higher O P/E Ratio O Earnings Per ShareQuestion 14 Which Company is valued for growth potential and could be more risky to invest in? Stock EPS P/ E _ Price Company A 15 4 $100 Company B 5 25 $100 A Company A A Company B Question 15 Which Company should be avoided at all costs? LULU LVMH SHOO DEST Net Income 952,181 13,196,000 69,973 -14,000 Shares Outstanding 124,920 503,880 83,190 14,350 Earnings Per Share (Net $7.62 $26.19 $0.84 Income/Shares Outstanding) -$0.98 Market Price Per Share 370.22 482.9 31.47 2.13 Earnings Per Share $7.62 $26.19 $0.84 -$0.98 P/E Ratio (Market Price/EPS) 48.57 18.44 37.41 -2.18 O LULU O LVMH O SHOO DEST