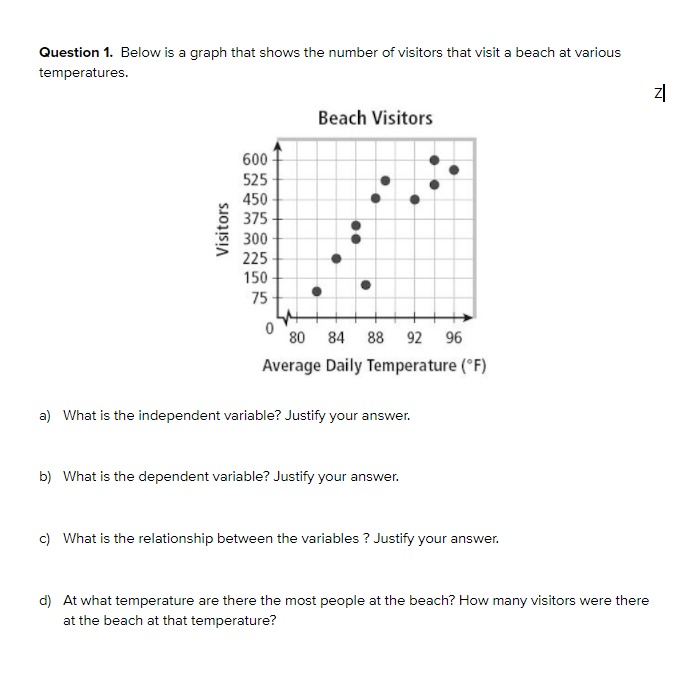
Question: Question 1. Below is a graph that shows the number of visitors that visit a beach at various temperatures. Z Beach Visitors 600 525 450

Question 1. Below is a graph that shows theQuestion 1. Below is a graph that shows the
Question 1. Below is a graph that shows the number of visitors that visit a beach at various temperatures. Z Beach Visitors 600 525 450 375 Visitors 300 225 150 75 80 84 88 92 96 Average Daily Temperature (F) ) What is the independent variable? Justify your answer. b) What is the dependent variable? Justify your answer. c) What is the relationship between the variables ? Justify your answer. d) At what temperature are there the most people at the beach? How many visitors were there at the beach at that temperature?Question 2. Ricardo belongs to a bird-watching club. Every two days, he goes out and counts the number of birds he sees. The scatter plot shows the number of birds he saw in the past 12 days. Bids 2 4 5 31012111115113 Darn Aer doing some calculations, Ricardo found that the equation of the line of best t is: y = 0.5x + 3 a} Based only on the graph does it seem reasonable that this could be the line of best t? Justify your answer. Note: Do not do any calculations here, you must only base your answer on the graph. b} Using Ricardo's equation, what is the amount o'Fbirds he saw on the 8th day? Is this interpolation or extrapolation? Show.r your work and Justify your answer. c} Using Ricardo's equation, how many birds is he expected to see on the 20th day? Is this interpolation or extrapolation? Show.r your work and Justify your

Step by Step Solution

There are 3 Steps involved in it

1 Expert Approved Answer
Step: 1 Unlock blur-text-image
Question Has Been Solved by an Expert!

Get step-by-step solutions from verified subject matter experts

Step: 2 Unlock
Step: 3 Unlock

Students Have Also Explored These Related Mathematics Questions!