

Question: Question 1 Below is a table with the forecasted costs for a project. There is a 30-day payment process cycle and the owner is retaining
Question 1
Below is a table with the forecasted costs for a project. There is a 30-day payment process cycle and the owner is retaining 10% of Month 1 and Month 2 costs, which will be paid in the final month. Assume that all monthly costs are invoiced at the end of the month.
- Complete Table A Cash Flow Calculations
- Determine the Peak Financial requirement for the project.
- If the peak financial commitment is borrowed from a bank, a line of credit, calculate the total cost to the contractor (calculate the future value of the loan). Interest rate = 13.2%, assume a four (4) month term.
- Create at cash flow graph with Dollars ($) on the y-axis and Time (Days) on the x-axis. Assume 22 workdays per month.
| Item | Item | Month 1 | Month 2 | Month 3 | Total |
| 1 | Labor | $6,270.00 | $14,700.00 | $17,855.00 | $38,825.00 |
| 2 | Materials | $5,928.00 | $15,825.00 | $6,325.00 | $28,078.00 |
| 3 | Subcontractor | $2,100.00 | $2,900.00 | $1,900.00 | $6,900.00 |
| 4 | Tools/Other Equipment | $725.00 | $1,250.00 | $580.00 | $2,555.00 |
| 5 | Field Office | $1,000.00 | $1,000.00 | $1,000.00 | $3,000.00 |
| 6 | Performance Bond | $1,400.00 | $1,400.00 | $1,400.00 | $4,200.00 |
| 7 | Main Office Utilities | $120.00 | $180.00 | $140.00 | $440.00 |
| 8 | Salaries of managers, clerical personnel and estimators | $3,200.00 | $3,200.00 | $3,200.00 | $9,600.00 |
| $20,743.00 | $40,455.00 | $32,400.00 | $93,598.00 |
NOTE: Use the following given template to answer.
| A. Cash Flow Calculations | |||||
| Month 1 | Month 2 | Month 3 | Month 4 | ||
| A | Beginning Carrying Balance | ||||
| B | Monthly Project Cost (Outflow) | ||||
| Peak Monthly Outflow | |||||
| C | Customer Invoice | ||||
| D | Invoice Retainage | ||||
| E | Invoice Payment (Inflow) | ||||
| F | Retainage Payment (Inflow) | ||||
| G | End Carrying Balance | ||||
NOTE: USE THE FOLLOWING TEMPLATE TO ANSWER OTHER PART
NOTE: PLEASE MAKE SURE THE ANSWER IS CORRECT. After solving, I need all Answers according to the templates.
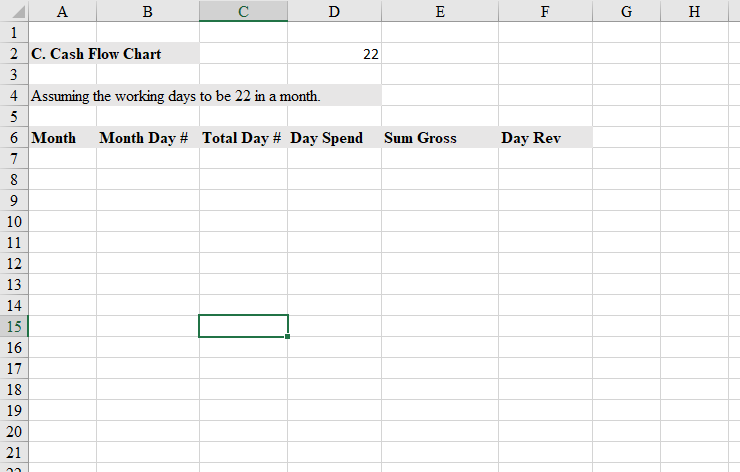
F G H Day Rev 8 A B D E 1 2 C. Cash Flow Chart 22 3 4 Assuming the working days to be 22 in a month. 5 6 Month Month Day# Total Day # Day Spend Sum Gross 7 8 9 10 11 12 13 14 15 16 17 18 19 20 21 5 6 8 F G H Day Rev 8 A B D E 1 2 C. Cash Flow Chart 22 3 4 Assuming the working days to be 22 in a month. 5 6 Month Month Day# Total Day # Day Spend Sum Gross 7 8 9 10 11 12 13 14 15 16 17 18 19 20 21 5 6 8
Step by Step Solution
There are 3 Steps involved in it

Get step-by-step solutions from verified subject matter experts