

Question: Question: 1. Calculate Forecasted Income Statement given the Base Year Amount 2. Calculate Forecasted Balan... 1. Calculate Forecasted Income Statement given the Base Year Amount
Question: 1. Calculate Forecasted Income Statement given the Base Year Amount 2. Calculate Forecasted Balan...

1. Calculate Forecasted Income Statement given the Base Year Amount
2. Calculate Forecasted Balance sheet Assets given the Base year Amount
3. Calculate Forecasted Balance Sheet Equities given the Base year Amount
4. Calculate Forecasted Cash Flow Statement- Operations
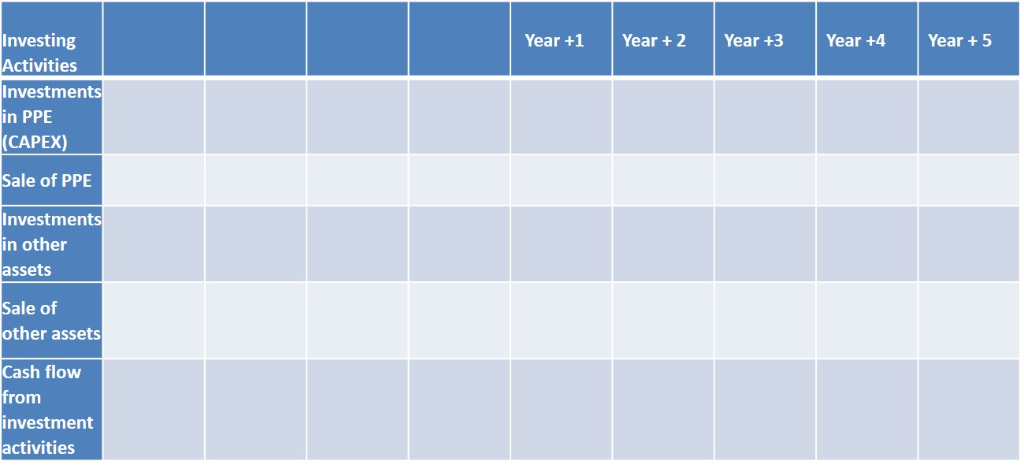
5. Calculate Forecasted Cash Flow Statement - Investing
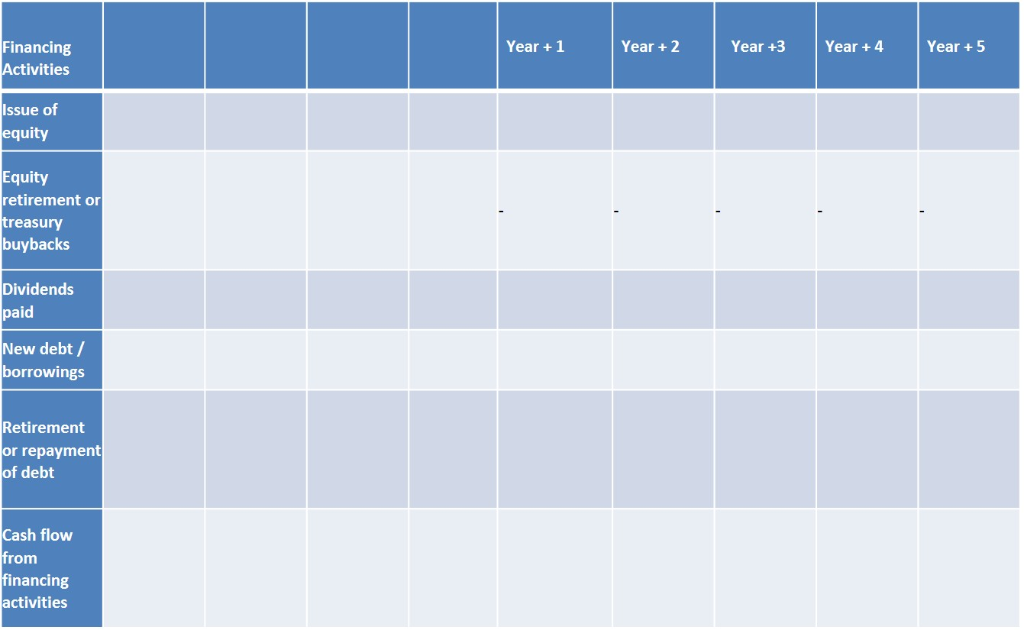
6. Calculate Forecasted Cash Flow Statement - Financing
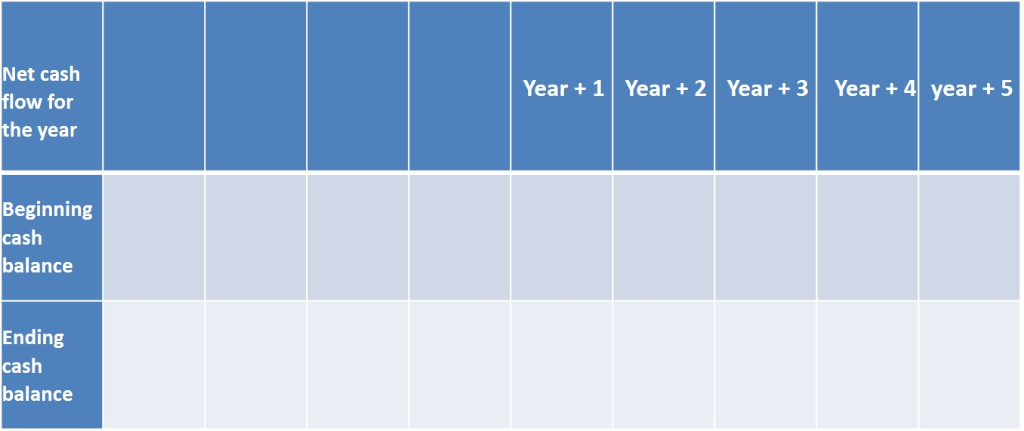
7. Calculate Forecasted Cash Flow Statement
8. Calculate Forecasted Free Cash Flows
9. Calculate Forecasted Debt Repayment and Dividend Payout
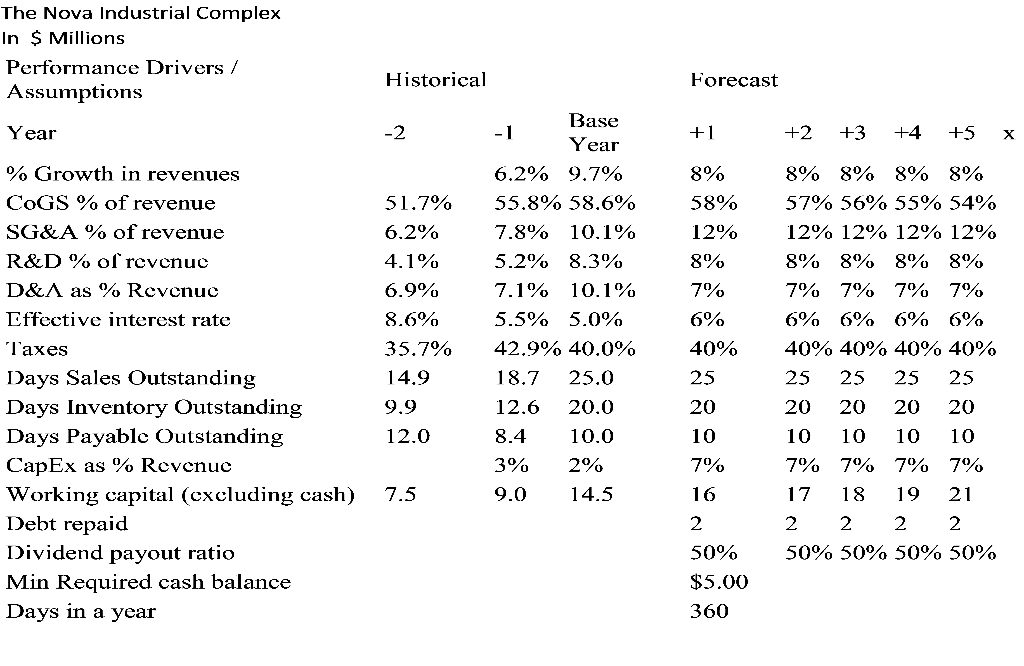
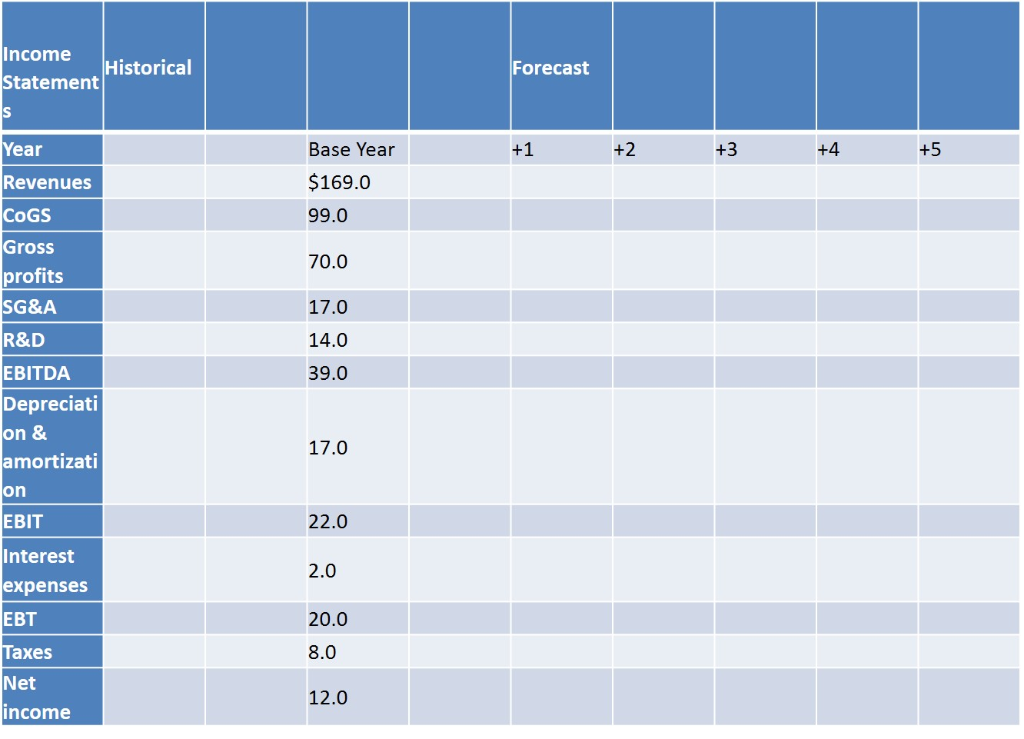
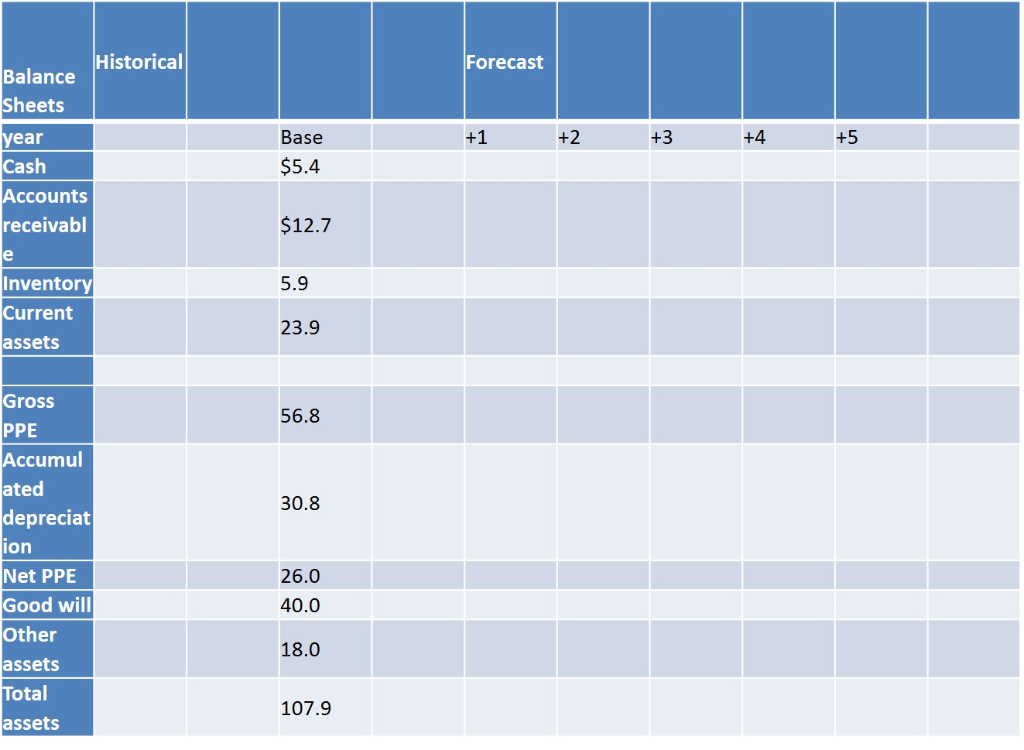
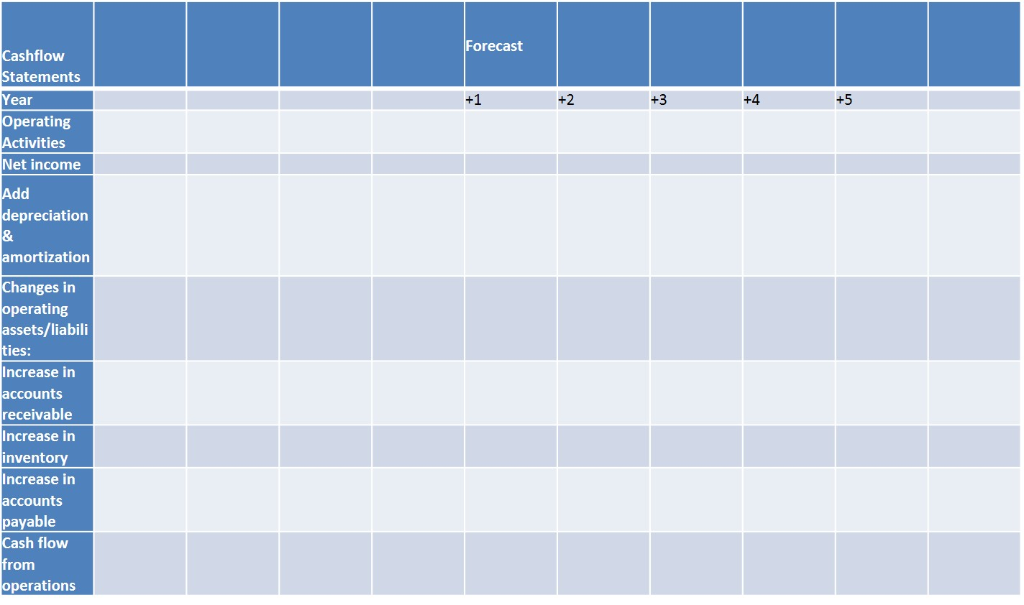
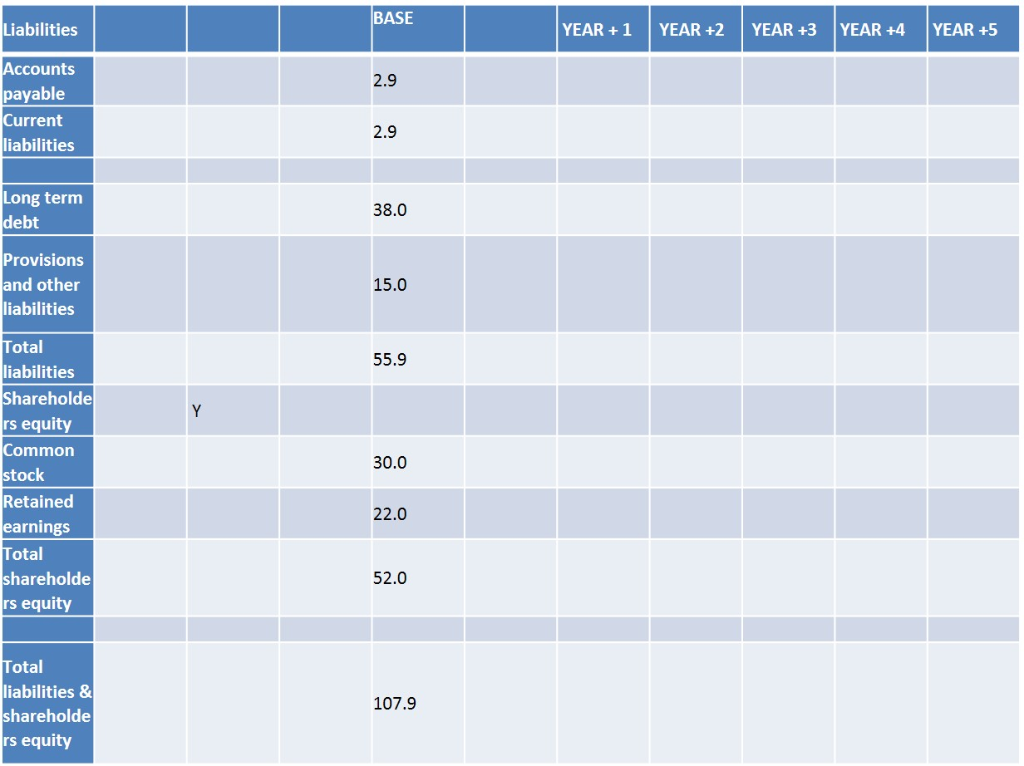
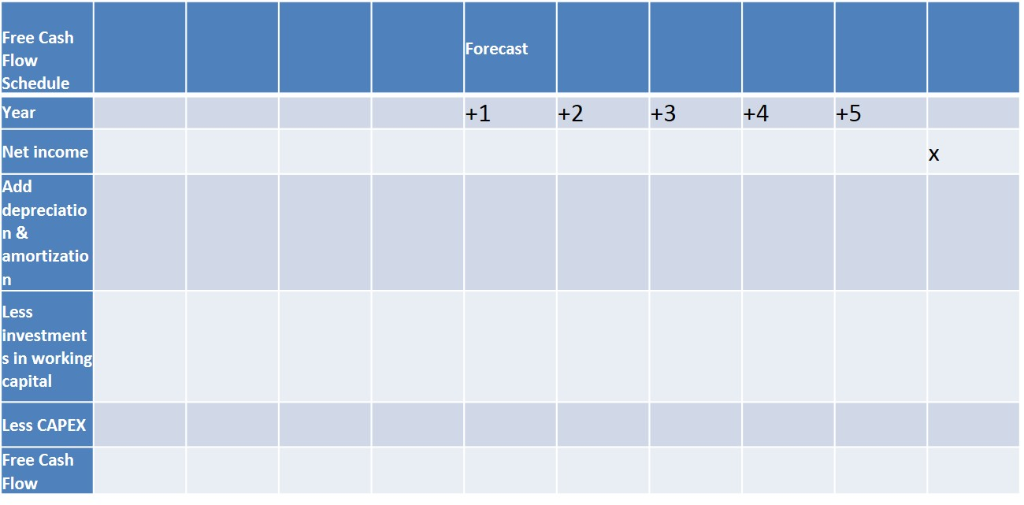
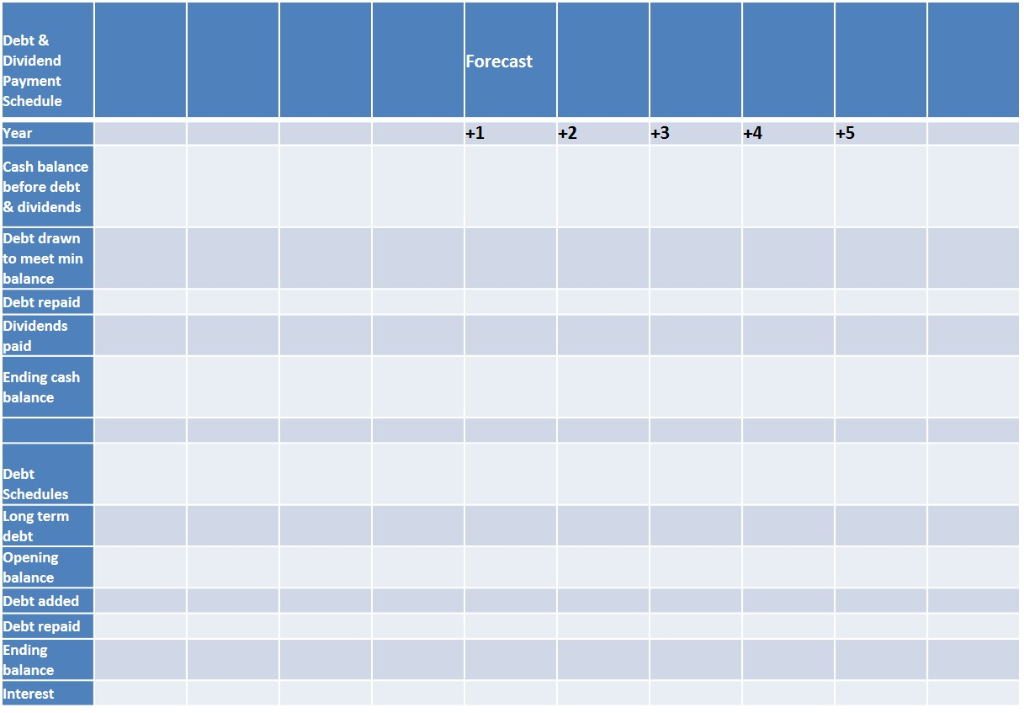
Note: Working capital, Debt repaid are both given in dollars NOT percentages. The Nova Industrial Complex In $ Millions Performance Drivers / Assumptions Historical Forecast Base ear 9.7% 2 +2 +3 +4+5 x 8% 57% 56% 55% 54% 12% 12% 12% 12% 8% 8% 8% 8% 7% 7% 7% 7% 6% 6% 6% 6% 40% 40% 4000 40% 25 25 25 25 20 20 20 20 10 10 1010 7% 7% 7% 7% 1718 19 21 Y ear % Growth in revenues COGS % of revenue SG&A % of revenue R&D % of revenue D&A as % Revenu Effective interest rate l'axes Days Sales Outstanding Days Inventory Outstanding Days Payablc Outstanding CapEx as % Reven uc Working capital (cxcluding cash) Debt repaid Dividend payout ratio Min Required cash balance Days in a year 6.2% 55.8% 58.6% 7.8% 5.2% 7.1% 5.5% 42.9% 40.0% 18.7 25.0 12.6 20.0 8.410.0 3% 2% 9.014.5 8% 58% 12% 8% 7% 6% 40% 25 20 10 7% 8% 8% 8% 51.7% 6.2% 4.1% 6.990 8.6% 35.7% 14.9 9.9 12.0 10.1% 8.3% 10.1% 5.0% 7.5 2 50% S5.00 360 50% 50% 50% 50% Historical Forecast Balance Sheets ear Base +1 +2 +3 +4 +5 Cash $5.4 ccounts receivabl $12.7 5.9 Inventory Current assets 23.9 Gross PPE Accumul ated depreciat ion Net PPE Good will Other assets 56.8 30.8 26.0 40.0 18.0 otal 107.9 assets Forecast ashflow tatements ear +1 perating tivities Net income epreciation mortization anges in perating ssets/liabili es: Increase in ccounts receivable Increase in invento Increase in ccounts payable ash flow rom peration:s BASE Liabilities YEAR +1 YEAR +2YEAR +3 YEAR +4 YEAR +5 Accounts payable Current liabilities 2.9 2.9 Long term debt 38.0 Provisions and other liabilities 15.0 otal liabilities 55.9 hareholde rs equity Common stock Retained earnings 30.0 22.0 otal shareholde rs equity 52.0 otal liabilities & shareholde rs equity 107.9 Investing Activities Investments in PPE (CAPEX) Sale of PPE Year +1 Year+2 Year +3 Year +4Year5 Investment in other assets Sale of other assets Cash flow from investment activities Financing Year +1 Year +2 Year +3 Year +4 Year 5 tivities Issue of UI Equity retirement or reasury buybacks Dividends paid New debt / borrowings Retirement r repayment f debt sh flow rom inancing activities Net cash flow for the year Year +1Year+2 Year +3 Year+4 year+5 Beginning cash balance Ending cash balance Free Cash Flow orecast chedule ear Net income epreciatio mortizatio Less investment in working apital Less CAPEX Free Cash Flow Debt & Dividend Payment orecast ule ear +4 sh balance before debt & dividends Debt drawn o meet min balance Debt repaid Dividends paid Ending cash balance Debt dules Long term ebt pening balance Debt added Debt repaid Ending balance Interest Note: Working capital, Debt repaid are both given in dollars NOT percentages. The Nova Industrial Complex In $ Millions Performance Drivers / Assumptions Historical Forecast Base ear 9.7% 2 +2 +3 +4+5 x 8% 57% 56% 55% 54% 12% 12% 12% 12% 8% 8% 8% 8% 7% 7% 7% 7% 6% 6% 6% 6% 40% 40% 4000 40% 25 25 25 25 20 20 20 20 10 10 1010 7% 7% 7% 7% 1718 19 21 Y ear % Growth in revenues COGS % of revenue SG&A % of revenue R&D % of revenue D&A as % Revenu Effective interest rate l'axes Days Sales Outstanding Days Inventory Outstanding Days Payablc Outstanding CapEx as % Reven uc Working capital (cxcluding cash) Debt repaid Dividend payout ratio Min Required cash balance Days in a year 6.2% 55.8% 58.6% 7.8% 5.2% 7.1% 5.5% 42.9% 40.0% 18.7 25.0 12.6 20.0 8.410.0 3% 2% 9.014.5 8% 58% 12% 8% 7% 6% 40% 25 20 10 7% 8% 8% 8% 51.7% 6.2% 4.1% 6.990 8.6% 35.7% 14.9 9.9 12.0 10.1% 8.3% 10.1% 5.0% 7.5 2 50% S5.00 360 50% 50% 50% 50% Historical Forecast Balance Sheets ear Base +1 +2 +3 +4 +5 Cash $5.4 ccounts receivabl $12.7 5.9 Inventory Current assets 23.9 Gross PPE Accumul ated depreciat ion Net PPE Good will Other assets 56.8 30.8 26.0 40.0 18.0 otal 107.9 assets Forecast ashflow tatements ear +1 perating tivities Net income epreciation mortization anges in perating ssets/liabili es: Increase in ccounts receivable Increase in invento Increase in ccounts payable ash flow rom peration:s BASE Liabilities YEAR +1 YEAR +2YEAR +3 YEAR +4 YEAR +5 Accounts payable Current liabilities 2.9 2.9 Long term debt 38.0 Provisions and other liabilities 15.0 otal liabilities 55.9 hareholde rs equity Common stock Retained earnings 30.0 22.0 otal shareholde rs equity 52.0 otal liabilities & shareholde rs equity 107.9 Investing Activities Investments in PPE (CAPEX) Sale of PPE Year +1 Year+2 Year +3 Year +4Year5 Investment in other assets Sale of other assets Cash flow from investment activities Financing Year +1 Year +2 Year +3 Year +4 Year 5 tivities Issue of UI Equity retirement or reasury buybacks Dividends paid New debt / borrowings Retirement r repayment f debt sh flow rom inancing activities Net cash flow for the year Year +1Year+2 Year +3 Year+4 year+5 Beginning cash balance Ending cash balance Free Cash Flow orecast chedule ear Net income epreciatio mortizatio Less investment in working apital Less CAPEX Free Cash Flow Debt & Dividend Payment orecast ule ear +4 sh balance before debt & dividends Debt drawn o meet min balance Debt repaid Dividends paid Ending cash balance Debt dules Long term ebt pening balance Debt added Debt repaid Ending balance Interest
Step by Step Solution
There are 3 Steps involved in it

Get step-by-step solutions from verified subject matter experts