

Question: QUESTION #1 Calculating Expected Returns and std dev with Unequal Probabilities: Suppose you thought a boom would occur 20 percent of the time instead of
QUESTION #1
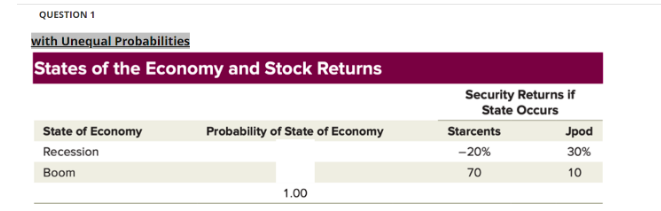
Calculating Expected Returns and std dev with Unequal Probabilities: Suppose you thought a boom would occur 20 percent of the time instead of 50 percent (So Recession probability = 1.00 0.20 = 0.80 )
- What are the expected returns on Starcents and Jpod in this case?
- If the risk-free rate is 10 percent, what are the risk premiums?
- What is the standard deviation of Starcents and Jpd, respectively?
QUESTION #2
Calculating Portfolio Expected Return and Std. dev with unequal portfolio weights : With the aforementioned scenario, now you decide to invest 30% into Starcents and 70% into Jpods
- What is the expected return of this portfolio?
- What is the correlation coefficient between Starcents and Jpod?
- What is the standard deviation of this portfolio?
- How much of diversification benefit did you achieve?
QUESTION #3
- What should be the portfolio weights for Starcents and Jpod, respectively, to achieve a Minimum-Variance Portfolio (MVP)?
- What is the standard deviation of the Minimum-Variance Portfolio (MVP)?
- What is the expected return of the Minimum-Variance Portfolio (MVP)?
QUESTION #4
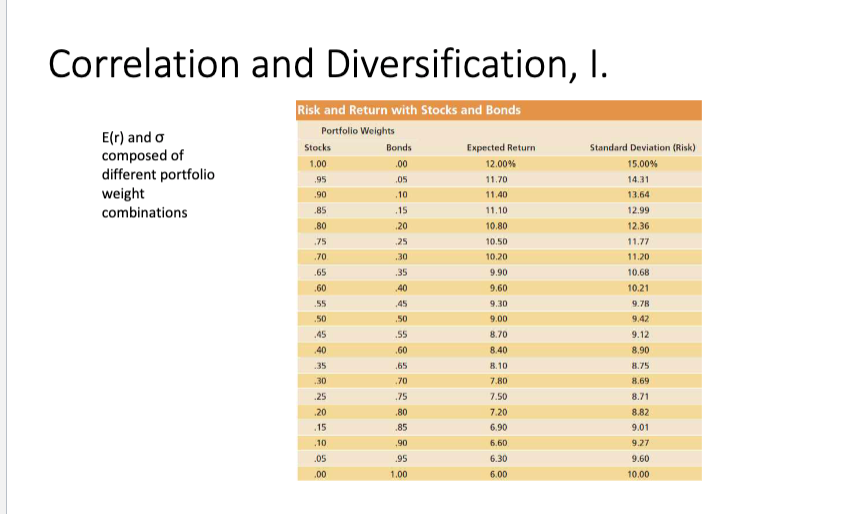
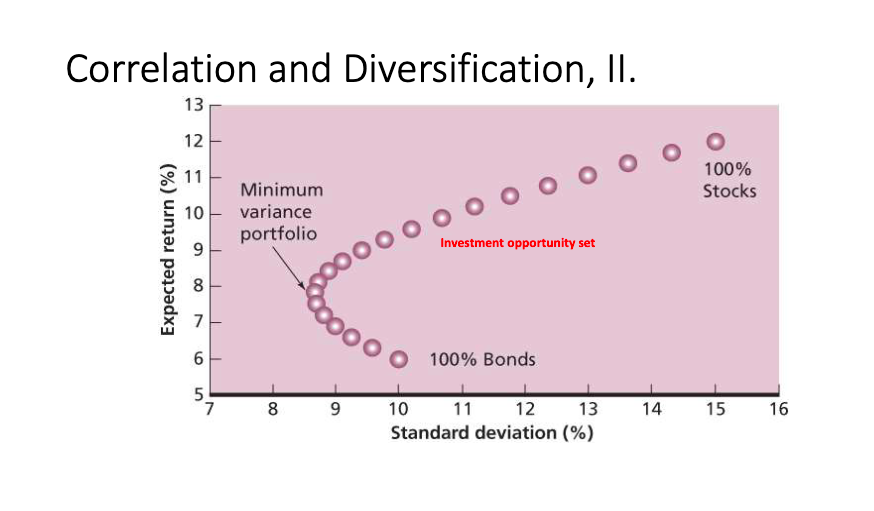
Create a table (similar to the one attached bellow: of portfolio expected return and standard deviation by varying portfolio weights. Then, draw the investment opportunity set (either using Excel or by hand-drawing neatly) for the portfolio and identify the efficient portfolios along with the minimum-variance portfolio.
QUESTION 1 with Unequal Probabilities States of the Economy and Stock Returns Security Returns if State Occurs \begin{tabular}{lccc} State of Economy & Probability of State of Economy & Starcents & Jpod \\ Recession & & 20% & 30% \\ Boom & 1.00 & 70 & 10 \\ \hline \end{tabular} Correlation and Diversification, I. E(r) and composed of different portfolio weight combinations Correlation and Diversification
Step by Step Solution
There are 3 Steps involved in it

Get step-by-step solutions from verified subject matter experts