

Question: Question 1 (CO2 P02 C3) Data in Table 1 below shows the desired temperature and the proportion of impurities passing through solid helium. Proportion of
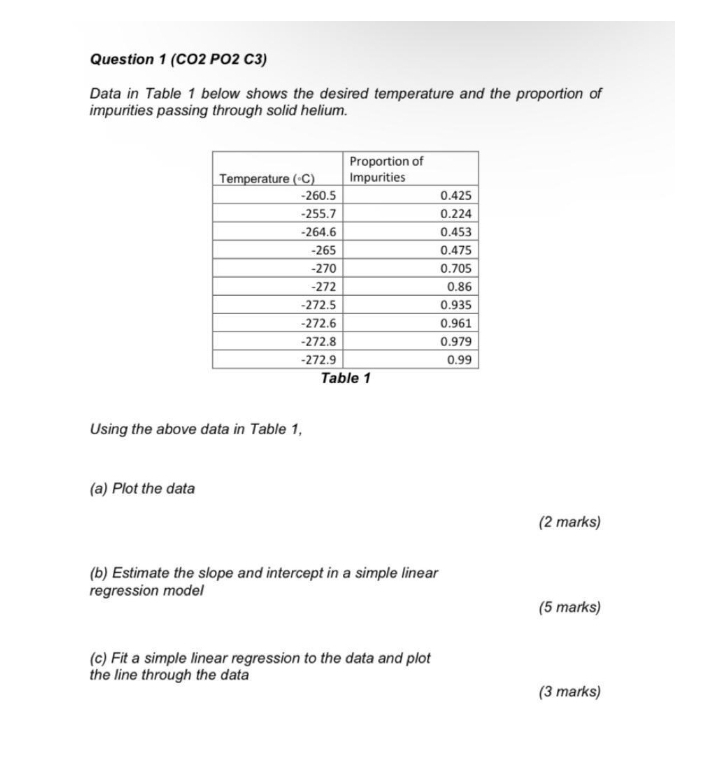
Question 1 (CO2 P02 C3) Data in Table 1 below shows the desired temperature and the proportion of impurities passing through solid helium. Proportion of Temperature (C) Impurities 260.5 0.425 255.7 0.224 -264.6 0.453 -265 0.475 -270 0.705 -272 0.86 272.5 0.935 -272.6 0.961 -272.8 0.979 -272.9 0.99 Table 1 Using the above data in Table 1, (a) Plot the data (2 marks) (b) Estimate the slope and intercept in a simple linear regression model (5 marks) (c) Fit a simple linear regression to the data and plot the line through the data
Step by Step Solution
There are 3 Steps involved in it
1 Expert Approved Answer
Step: 1 Unlock

Question Has Been Solved by an Expert!
Get step-by-step solutions from verified subject matter experts
Step: 2 Unlock
Step: 3 Unlock