

Question: QUESTION 1 Consider a Z test for p with the hypotheses: H 0 : p = 0.6 H A : p?0.6 Suppose the test statistic
QUESTION 1
- Consider a Z test for p with the hypotheses:
- H0: p = 0.6
- HA: p?0.6
Suppose the test statistic is z = 2.78.
Given that P(Z
- 0.0027
- 0.0054
- 0.6
- 0.9973
QUESTION 2
Suppose that in a random sample of 90 of a city's houses, 51 are occupied by renters. Using the formula in the course notes, what is a 95% confidence interval for the true proportion of the city's houses that are occupied by renters?
- [0.481, 0.653]
- [0.464, 0.669]
- [0.282, 0.441]
- [-1.96, 1.96]
QUESTION 3
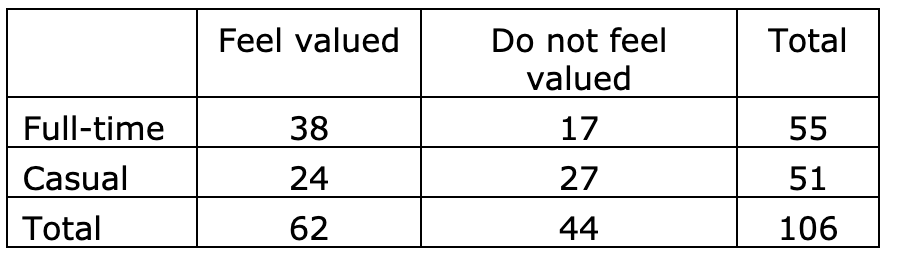
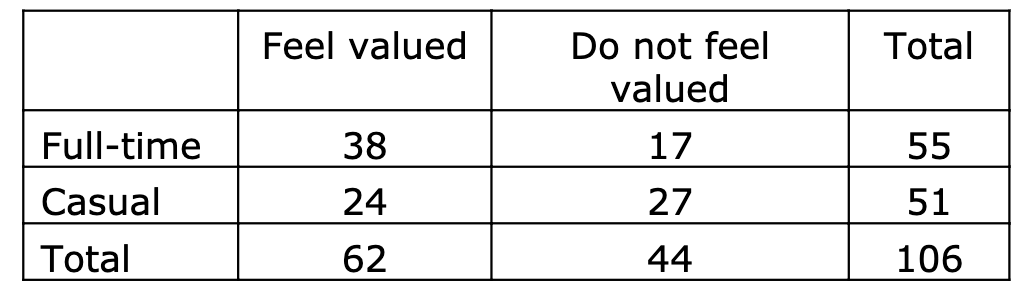
Suppose a company takes a random sample of its casual and full-time employees and asks them to anonymously report whether they feel valued, with the results summarised in the table below:
![the city's houses that are occupied by renters? [0.481, 0.653][0.464, 0.669][0.282, 0.441][-1.96,](https://dsd5zvtm8ll6.cloudfront.net/si.experts.images/questions/2024/09/66eed31ea86b4_64666eed31e94b76.jpg)
![1.96] QUESTION 3Suppose a company takes a random sample of its casual](https://dsd5zvtm8ll6.cloudfront.net/si.experts.images/questions/2024/09/66eed31f18cef_64666eed31edb4f1.jpg)
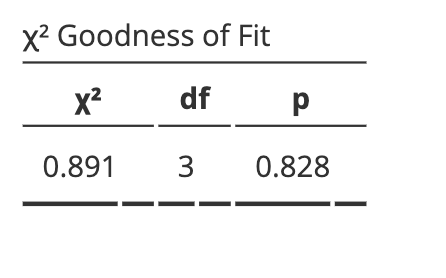
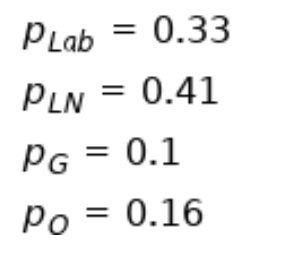
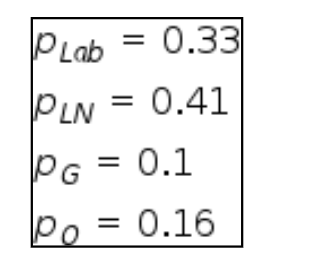
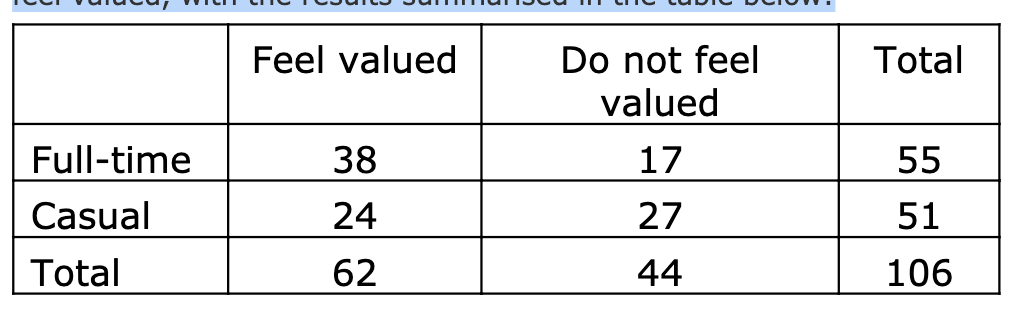
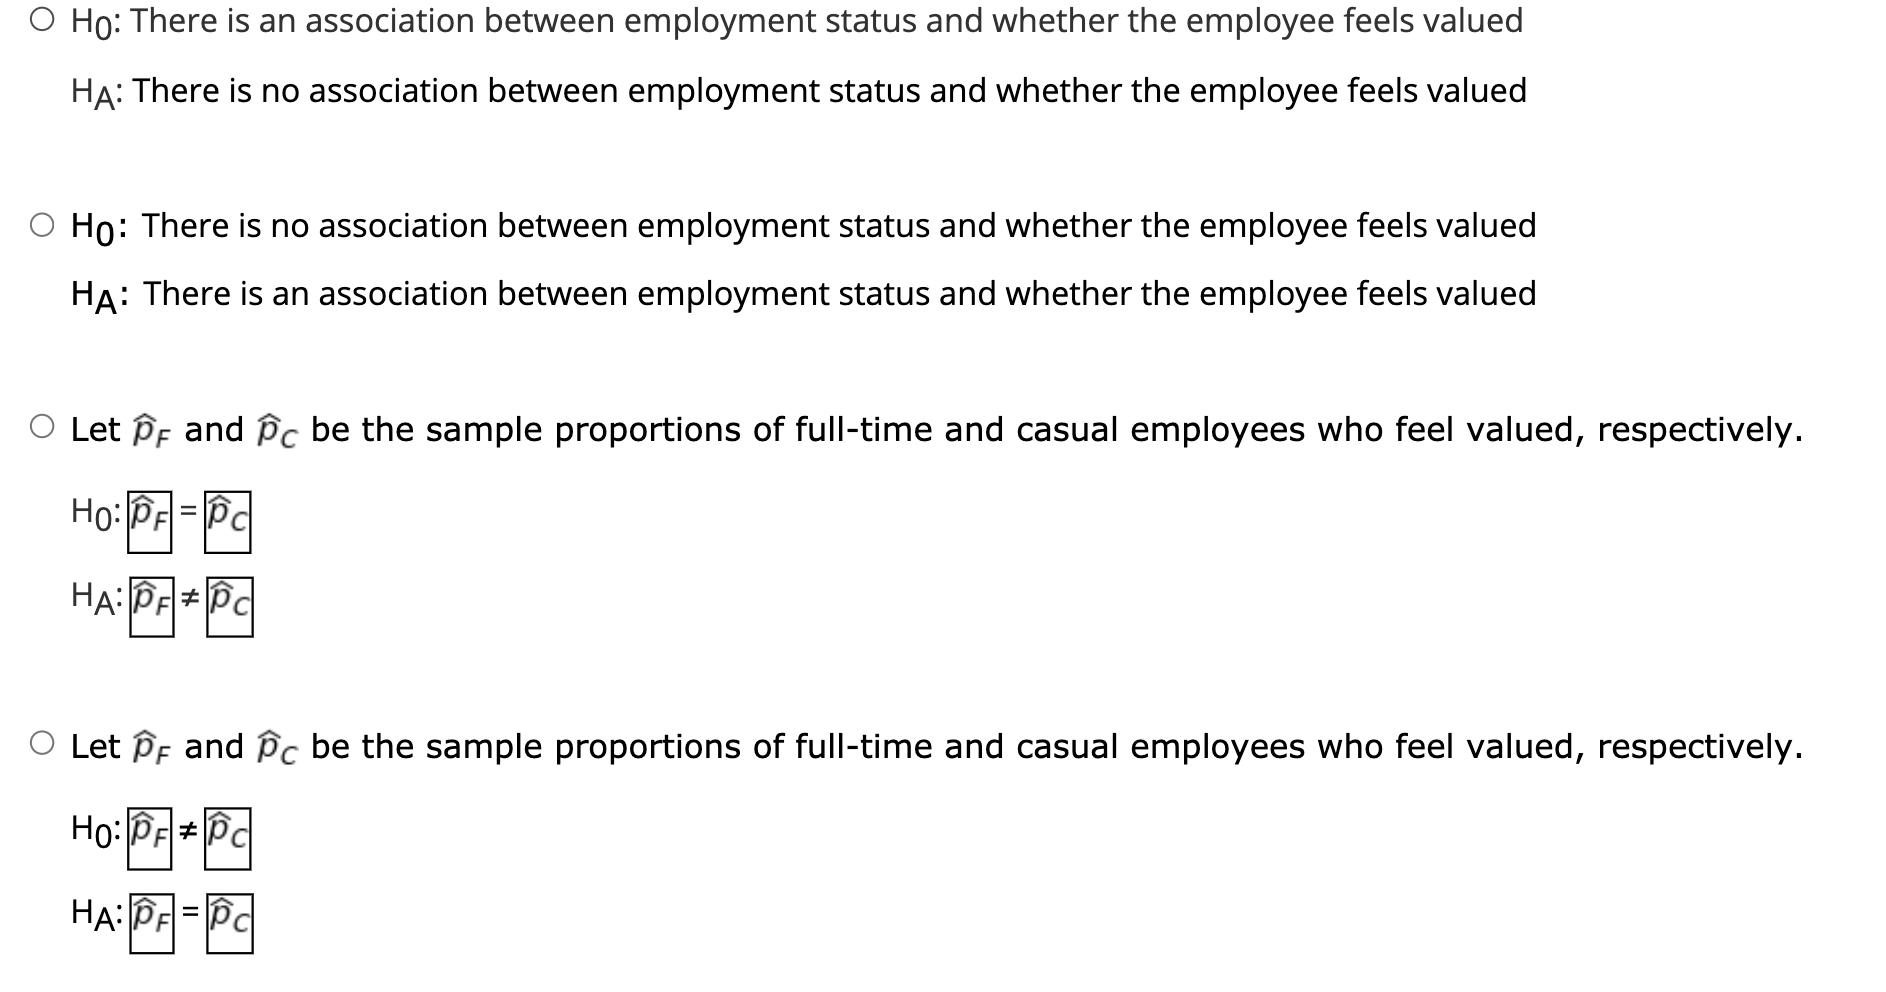
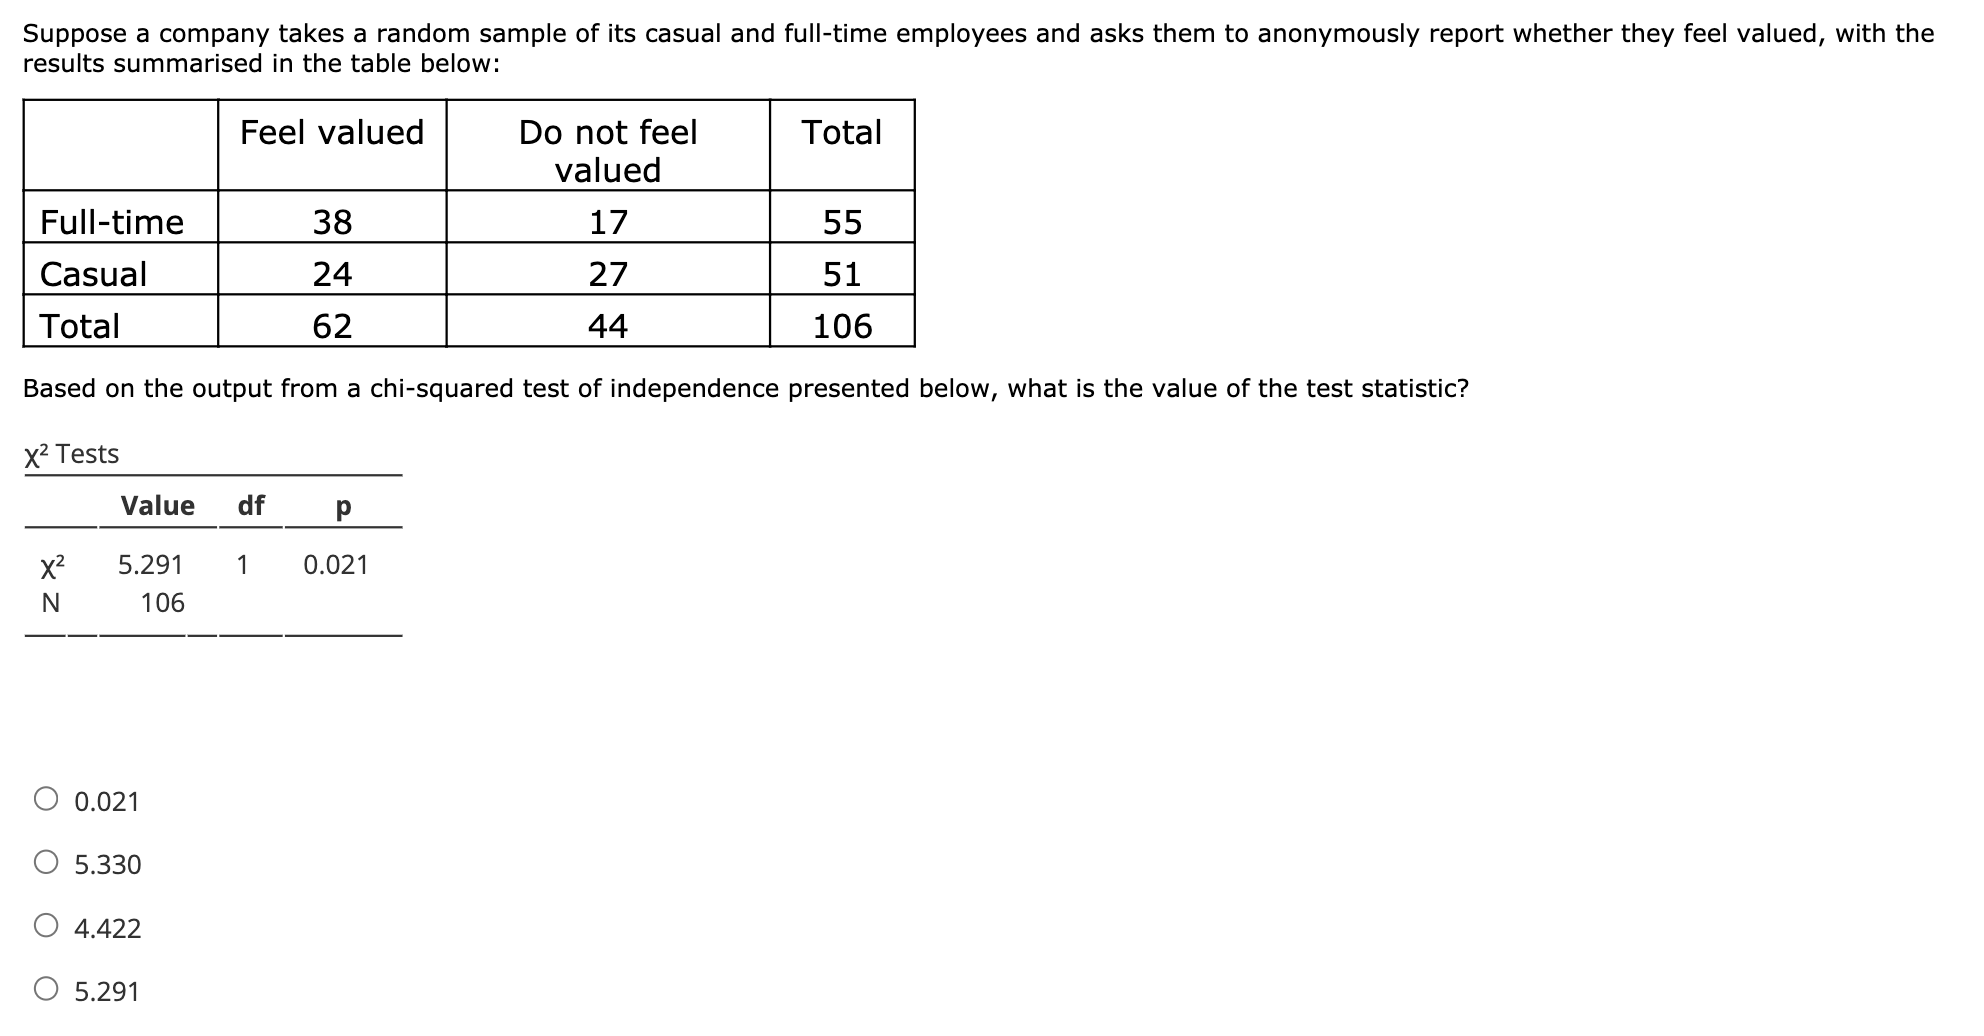
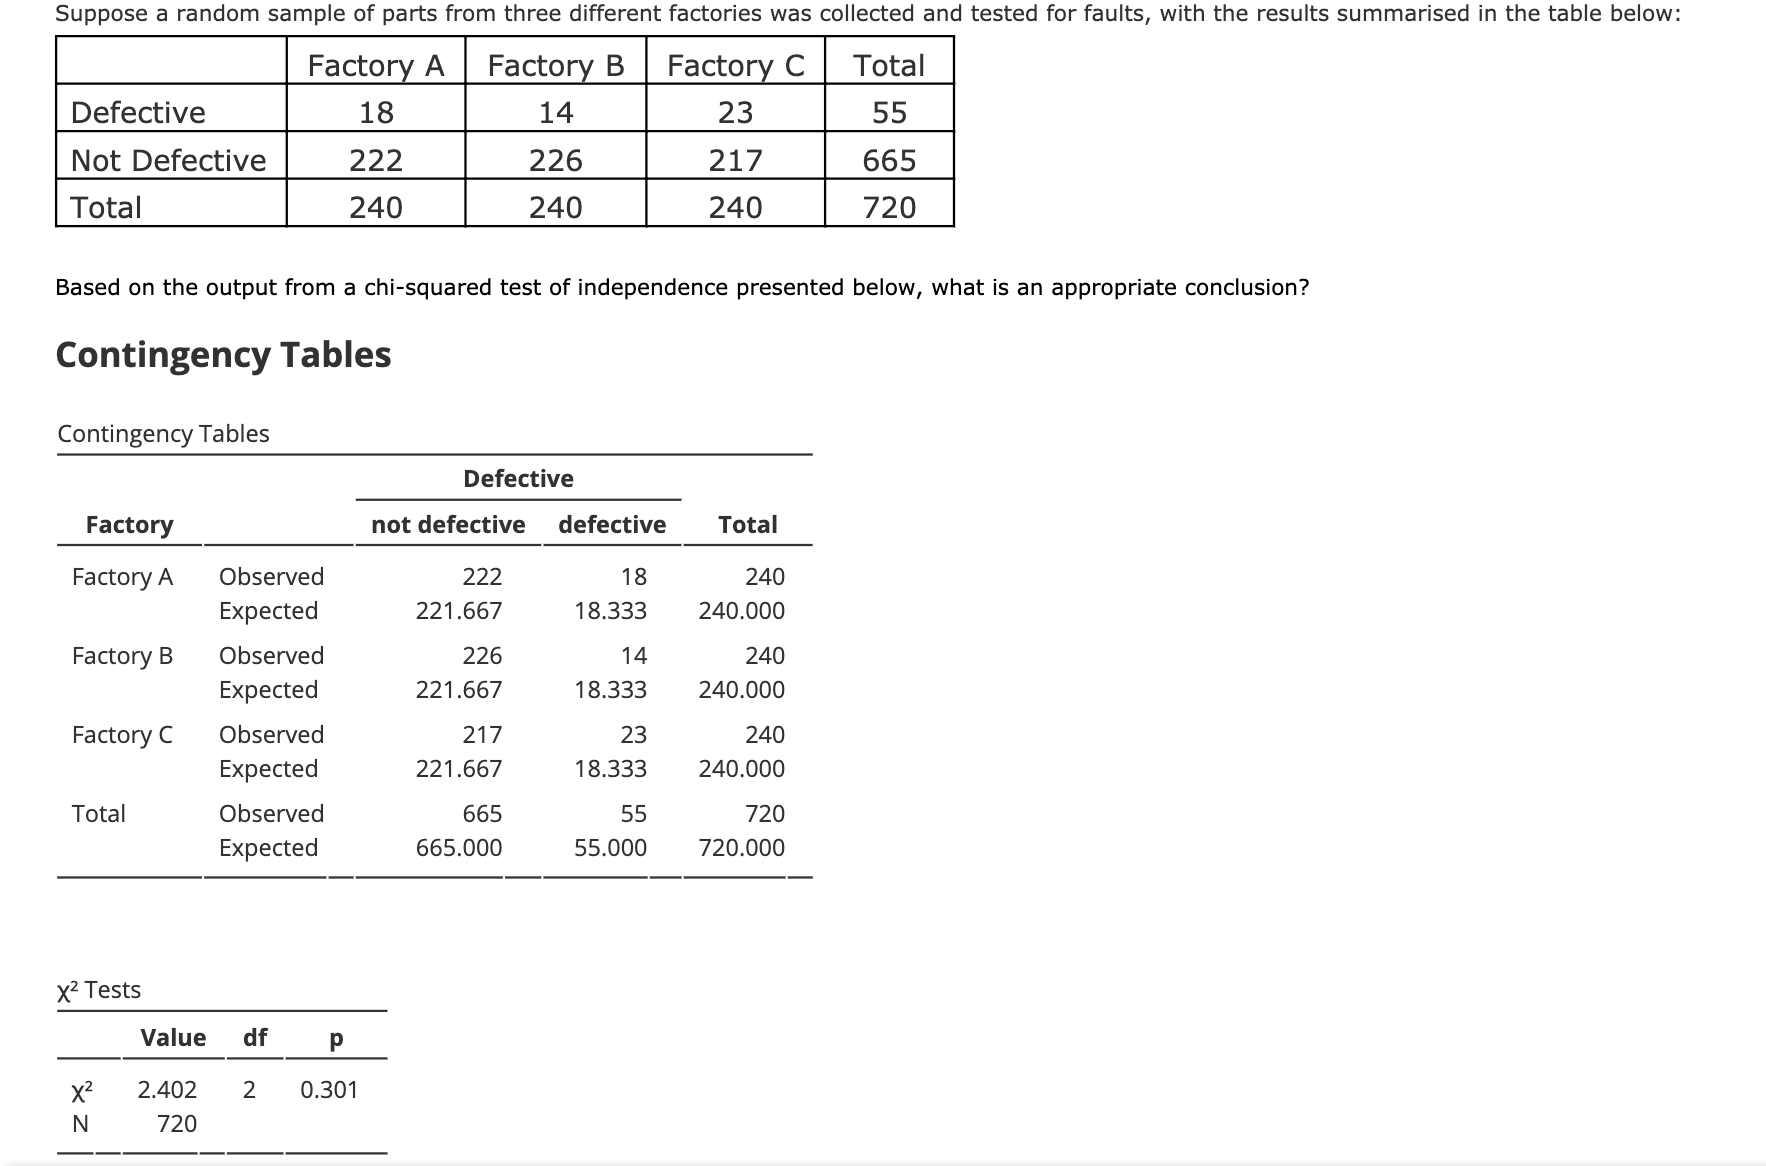
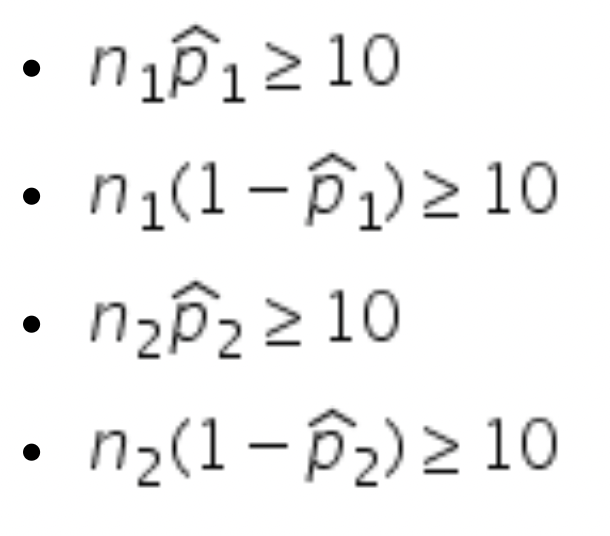
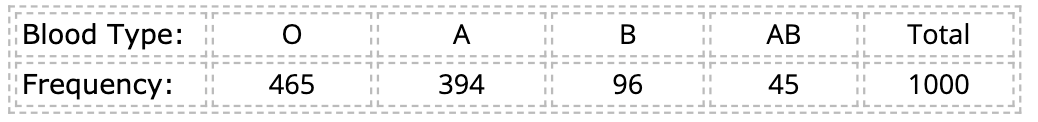
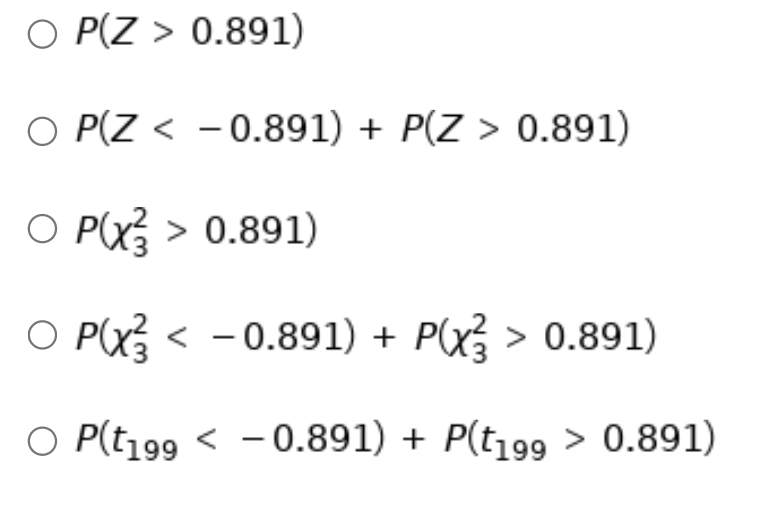
\f. nip12 10 . n1(1 - p1) 2 10 . n2P2 2 10 . n2(1 - P2) 210\f\fFeel valued Do not feel Total valued Full-time 38 17 55 Casual 24 27 51 Total 62 44 106Party Labor Liberal/National Green Other Total II Preference: II Frequency: 71 81 20 28 200Proportion Test (N Outcomes) Proportions - Party Level Count Proportion Labor Observed 71 0.355 Expected 66.000 0.330 Liberal/National Observed 81 0.405 Expected 82.000 0.410 Green Observed 20 0.100 Expected 20.000 0.100 Other Observed 28 0.140 Expected 32.000 0.160x2 Goodness of Fit X2 df 0.891 W 0.828PLab = 0.33 PLN = 0.41 PG = 0.1 Po = 0.16PLab = 0.33 PLN = 0.41 PG = 0.1 po 0.16PLab = 0.25 PLN = 0.25 PG = 0.25 Po = 0.25Feel valued Do not feel Total valued Full-time 38 17 55 Casual 24 27 51 Total 62 44 106H0: There is an association between employment status and whether the employee feels valued HA: There is no association between employment status and whether the employee feels valued H0: There is no association between employment status and whether the employee feels valued HA: There is an association between employment status and whether the employee feels valued Let ; and g be the sample proportions of fulltime and casual employees who feel valued, respectively. we HAzlatE Let if; and g be the sample proportions of fulltime and casual employees who feel valued, respectively. Hotlal are Suppose a company takes a random sample of its casual and full-time employees and asks them to anonymously report whether they feel valued, with the results summarised in the table below: - Feel valued Do not feel valued -z-- Based on the output from a chi-squared test of independence presented below, what is the value of the test statistic? x1 Tests Value df p x2 5.291 \"I 0.021 N 106 O 0.021 O 5.330 O 4.422 O 5.291 Suppose a random sample of parts from three different factories was collected and tested for faults, with the results summarised in the table below: -m-- _n m Based on the output from a chi-squared test of independence presented below, what is an appropriate conclusion? Contingency Tables Contingency Tables Defective Factory not defective defective Total Factory A Observed 222 18 240 Expected 221 .667 18.333 240.000 Factory B Observed 226 '14 240 Expected 221 .667 18.333 240.000 Factory C Observed 217 23 240 Expected 221 .667 18.333 240.000 Total Observed 665 55 720 Expected 665.000 55.000 720.000 x2 Tests Value df p x2 2.402 2 0.301 N 720
Step by Step Solution
There are 3 Steps involved in it

Get step-by-step solutions from verified subject matter experts