

Question: Question 1 . Consider an upward sloping short Run Aggregate Supply Curve & a consider a vertical long run aggregate supply curve. A) Show the
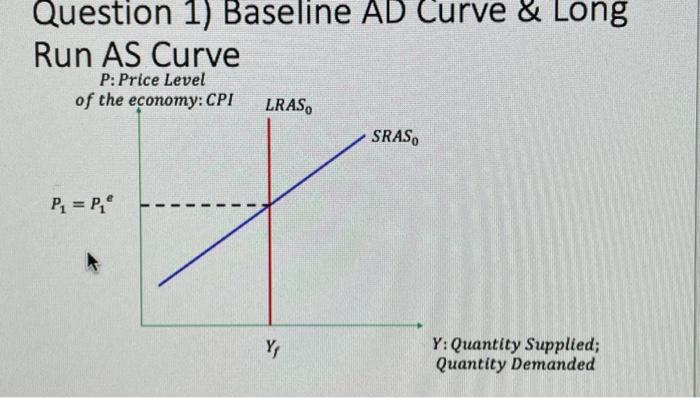
Question 1 . Consider an upward sloping short Run Aggregate Supply Curve & a consider a vertical long run aggregate supply curve. A) Show the short run aggregate supply curve and the long run aggregate supply curve on Graph 1A; specifically show a point where the price level is 30; price expectation is 30 and full employment output is 80. On the graph also point out the rate of uneniployment at this full employment output (suppose this is for USA) B) Suppose oil prices are increase. Show Graph 1B to show which curve shifts in which direction; You will assume that there is full flexibility of nominal wages and the price level such that money is neutral in the long run. Give a brief explanation for your results. Question 1) Baseline AD Curve & Long Run AS Curve P: Price Level of the economy: CPI LRAS, SRAS, P =P Y Y: Quantity Supplied; Quantity Demanded
Step by Step Solution
There are 3 Steps involved in it

Get step-by-step solutions from verified subject matter experts