

Question: QUESTION 1 Consider the 11-day sample data for an icecream truck business shown in the following table. Price = Per unit price of ice cream

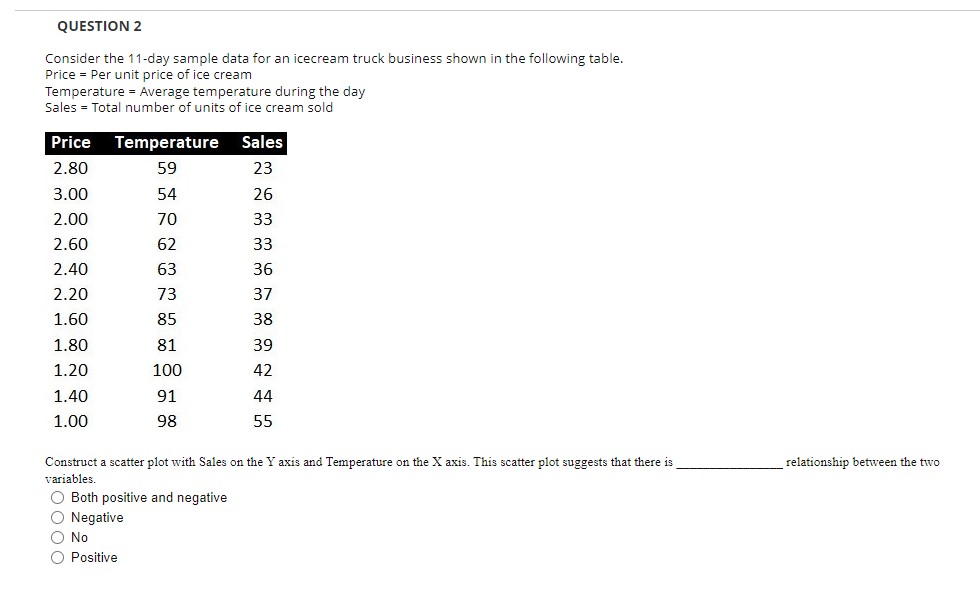
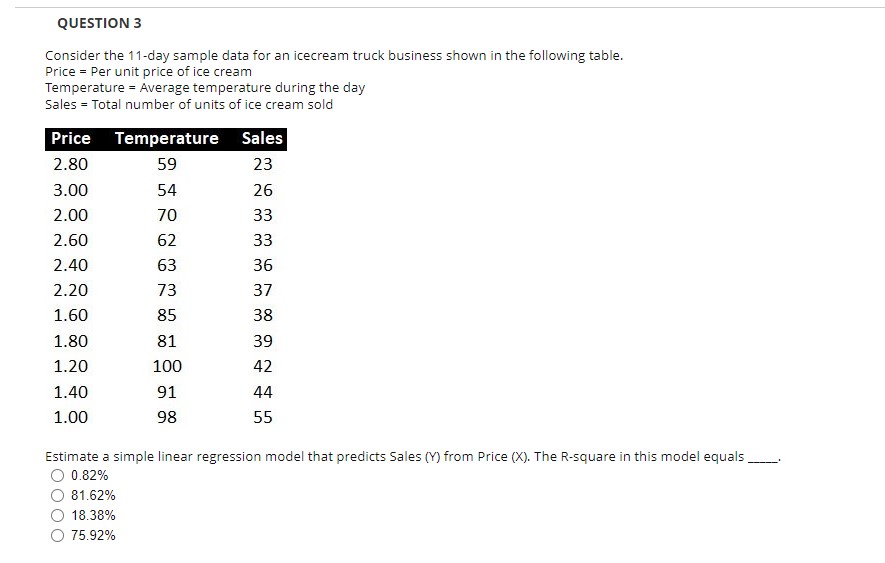
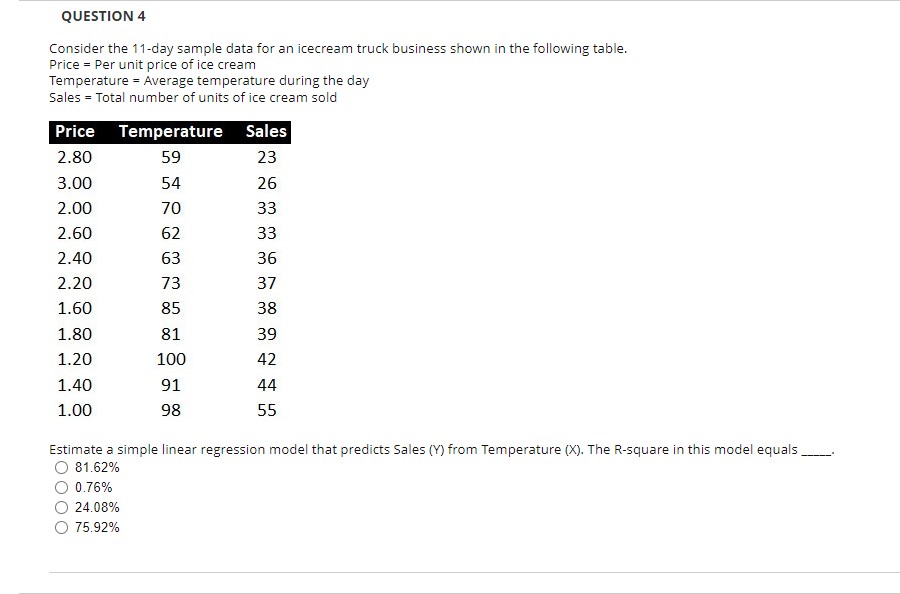

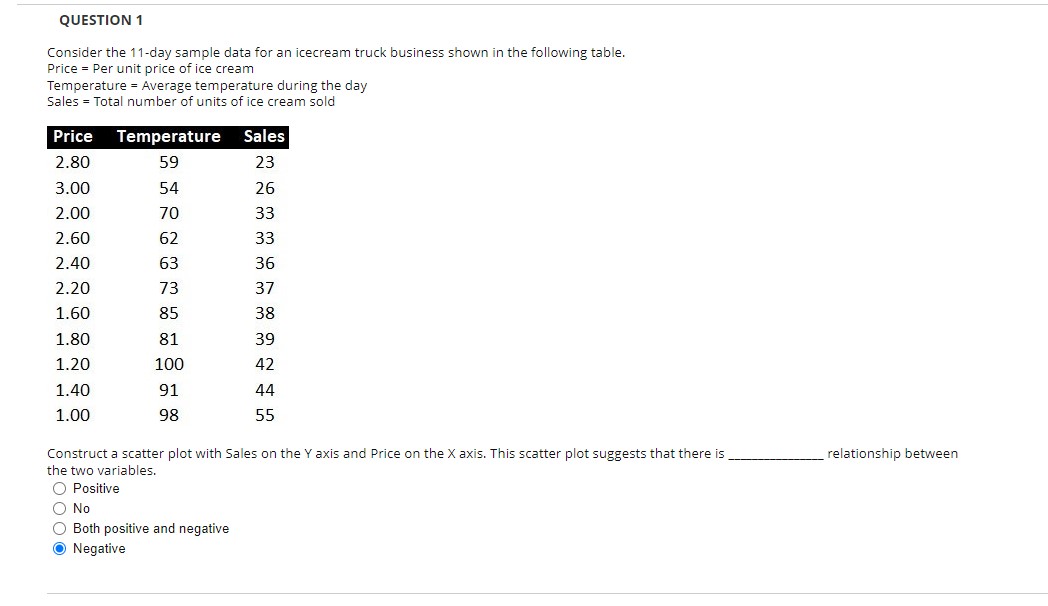


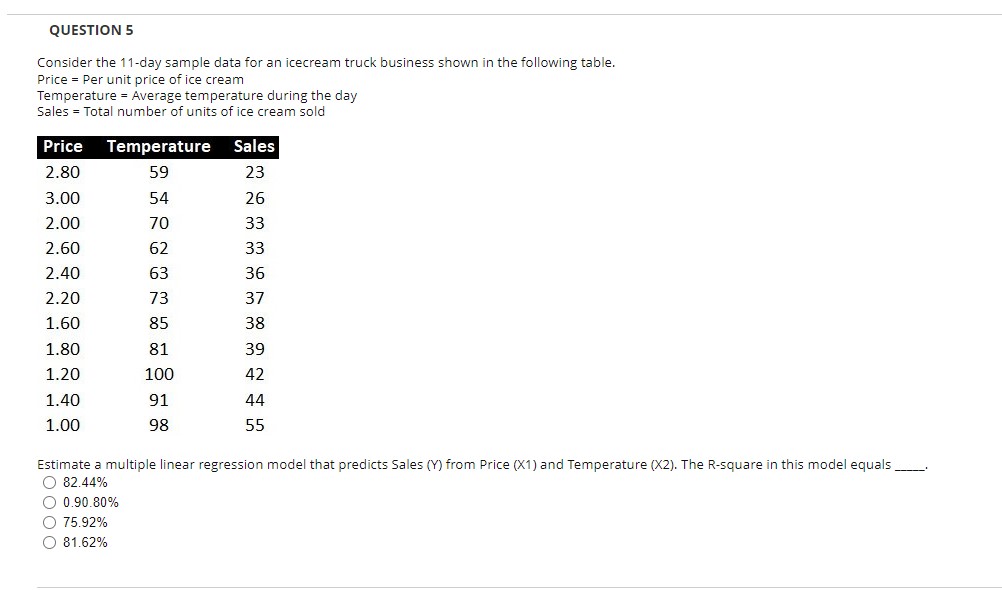
QUESTION 1 Consider the 11-day sample data for an icecream truck business shown in the following table. Price = Per unit price of ice cream Temperature = Average temperature during the day Sales = Total number of units of ice cream sold Price Temperature Sales 2.80 59 23 3.00 54 26 2.00 70 33 2.60 62 33 2.40 63 36 2.20 73 37 1.60 85 38 1.80 81 39 1.20 100 42 1.40 91 44 1.00 98 55 Construct a scatter plot with Sales on the Y axis and Price on the X axis. This scatter plot suggests that there is relationship between the two variables O Positive O No O Both positive and negative O NegativeQUESTION 2 Consider the 11-day sample data for an icecream truck business shown in the following table. Price = Per unit price of ice cream Temperature = Average temperature during the day Sales = Total number of units of ice cream sold Price Temperature Sales 2.80 59 23 3.00 54 26 2.00 70 33 2.60 62 33 2.40 63 36 2.20 73 37 1.60 85 38 1.80 81 39 1.20 100 42 1.40 91 44 1.00 98 55 Construct a scatter plot with Sales on the Y axis and Temperature on the X axis. This scatter plot suggests that there is variables. relationship between the two O Both positive and negative O Negative O No O PositiveQUESTION 3 Consider the 11-day sample data for an icecream truck business shown in the following table. Price = Per unit price of ice cream Temperature = Average temperature during the day Sales = Total number of units of ice cream sold Price Temperature Sales 2.80 59 23 3.00 54 26 2.00 70 33 2.60 62 33 2.40 63 36 2.20 73 37 1.60 85 38 1.80 81 39 1.20 100 42 1.40 91 44 1.00 98 55 Estimate a simple linear regression model that predicts Sales (Y) from Price (X). The R-square in this model equals O 0.82% O 81.62% O 18.38% O 75.92%QUESTION 4 Consider the 11-day sample data for an icecream truck business shown in the following table. Price = Per unit price of ice cream Temperature = Average temperature during the day Sales = Total number of units of ice cream sold Price Temperature Sales 2.80 59 23 3.00 54 26 2.00 70 33 2.60 62 33 2.40 63 36 2.20 73 37 1.60 85 38 1.80 81 39 1.20 100 42 1.40 91 44 1.00 98 55 Estimate a simple linear regression model that predicts Sales (Y) from Temperature (X). The R-square in this model equals O 81.62% O 0.76% O 24.08% O 75.92%QUESTION 5 Consider the 11-day sample data for an icecream truck business shown in the following table. Price = Per unit price of ice cream Temperature = Average temperature during the day Sales = Total number of units of ice cream sold Price Temperature Sales 2.80 59 23 3.00 54 26 2.00 70 33 2.60 62 33 2.40 63 36 2.20 73 37 1.60 85 38 1.80 81 39 1.20 100 42 1.40 91 44 1.00 98 55 Estimate a multiple linear regression model that predicts Sales (Y) from Price (X1) and Temperature (X2). The R-square in this model equals O 82.44% O 0.90.80% O 75.92% O 81.62%
Step by Step Solution
There are 3 Steps involved in it

Get step-by-step solutions from verified subject matter experts