

Question: Question 1 Consider the following distribution: test net volume n=653 200 300 Frequency 100 ml Assume the x-axis contains the full domain of values. The
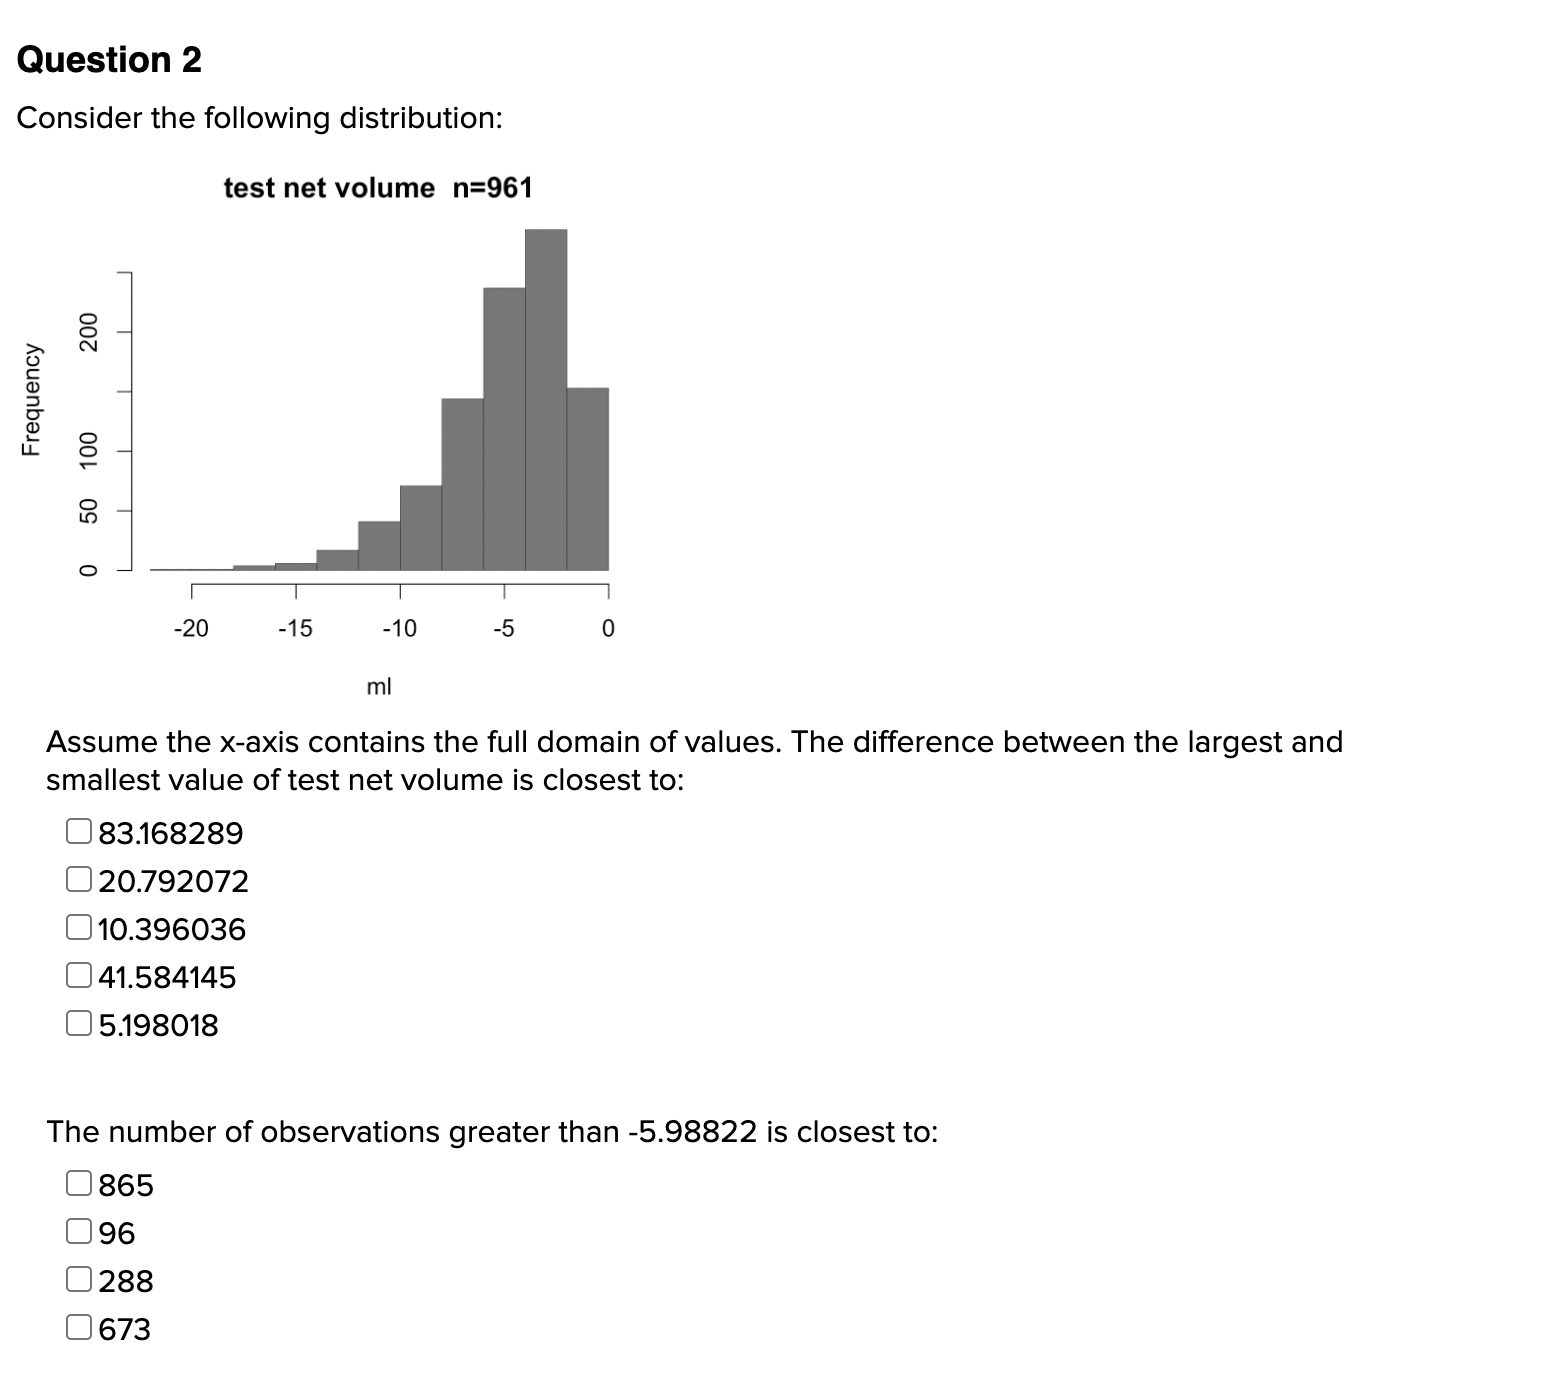
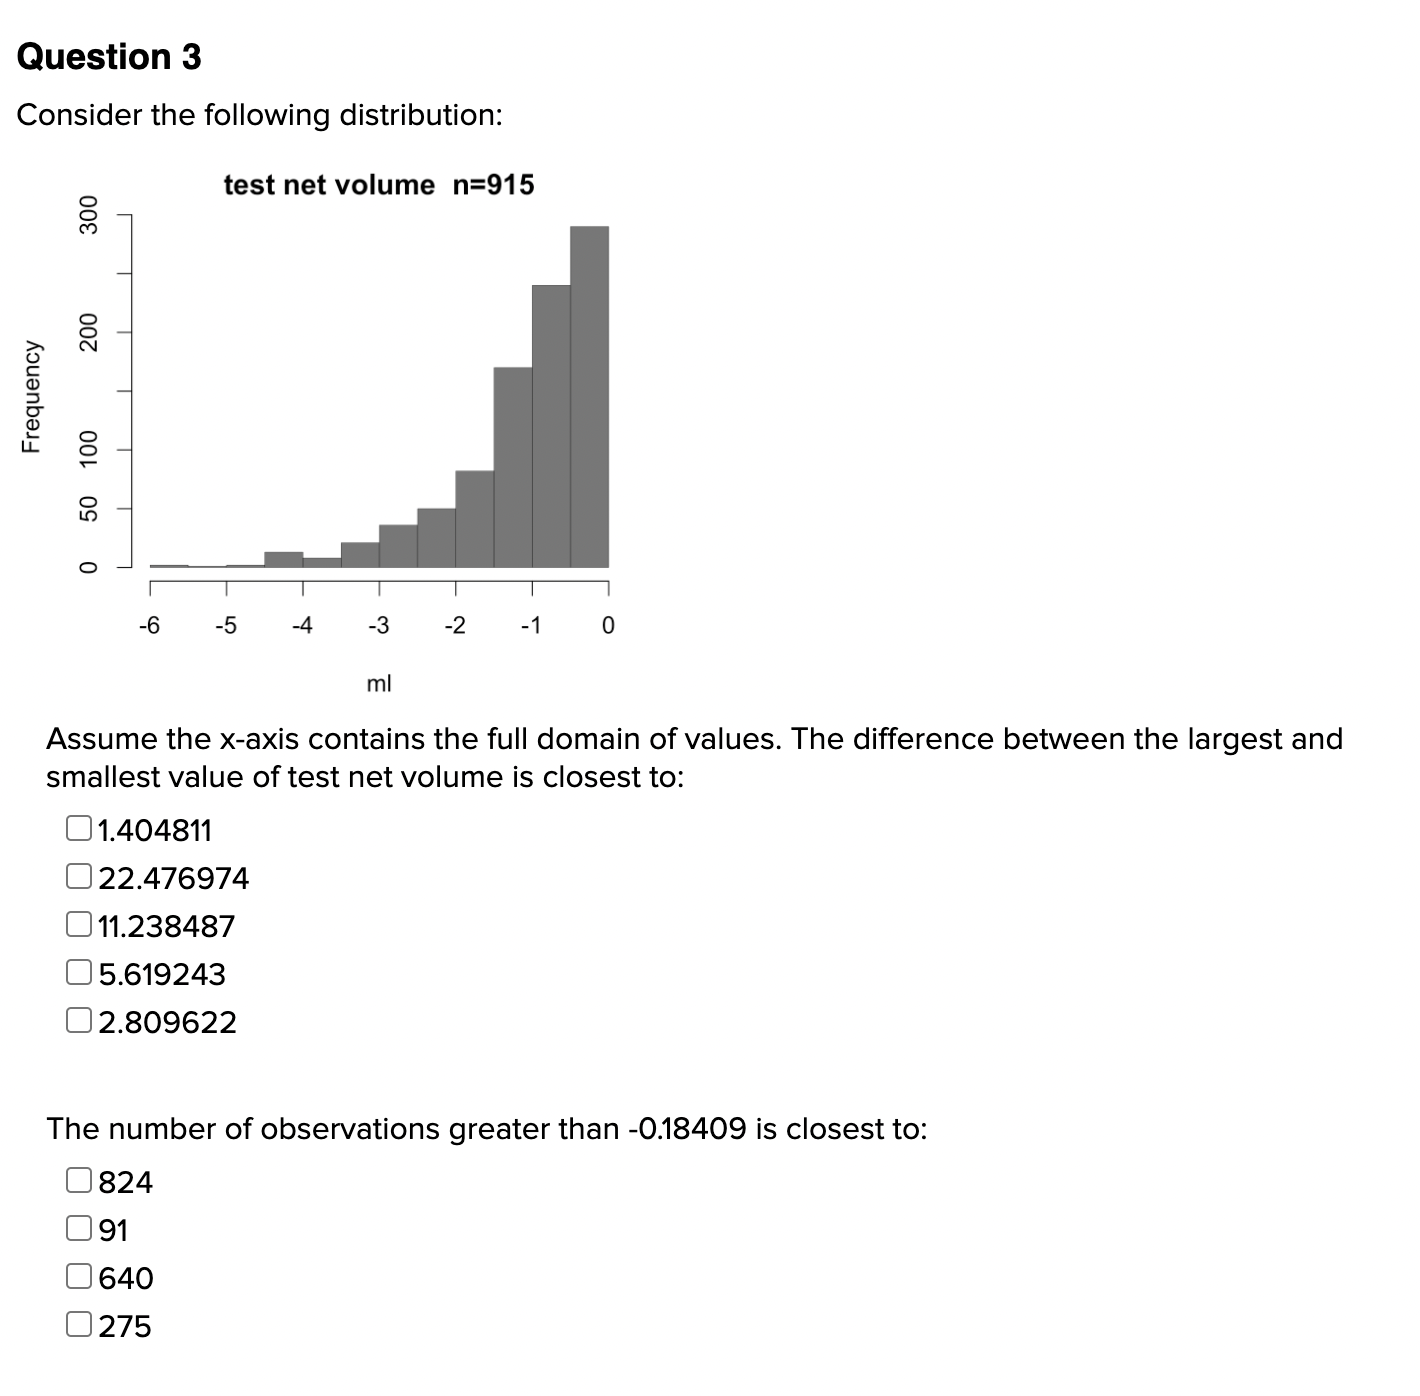
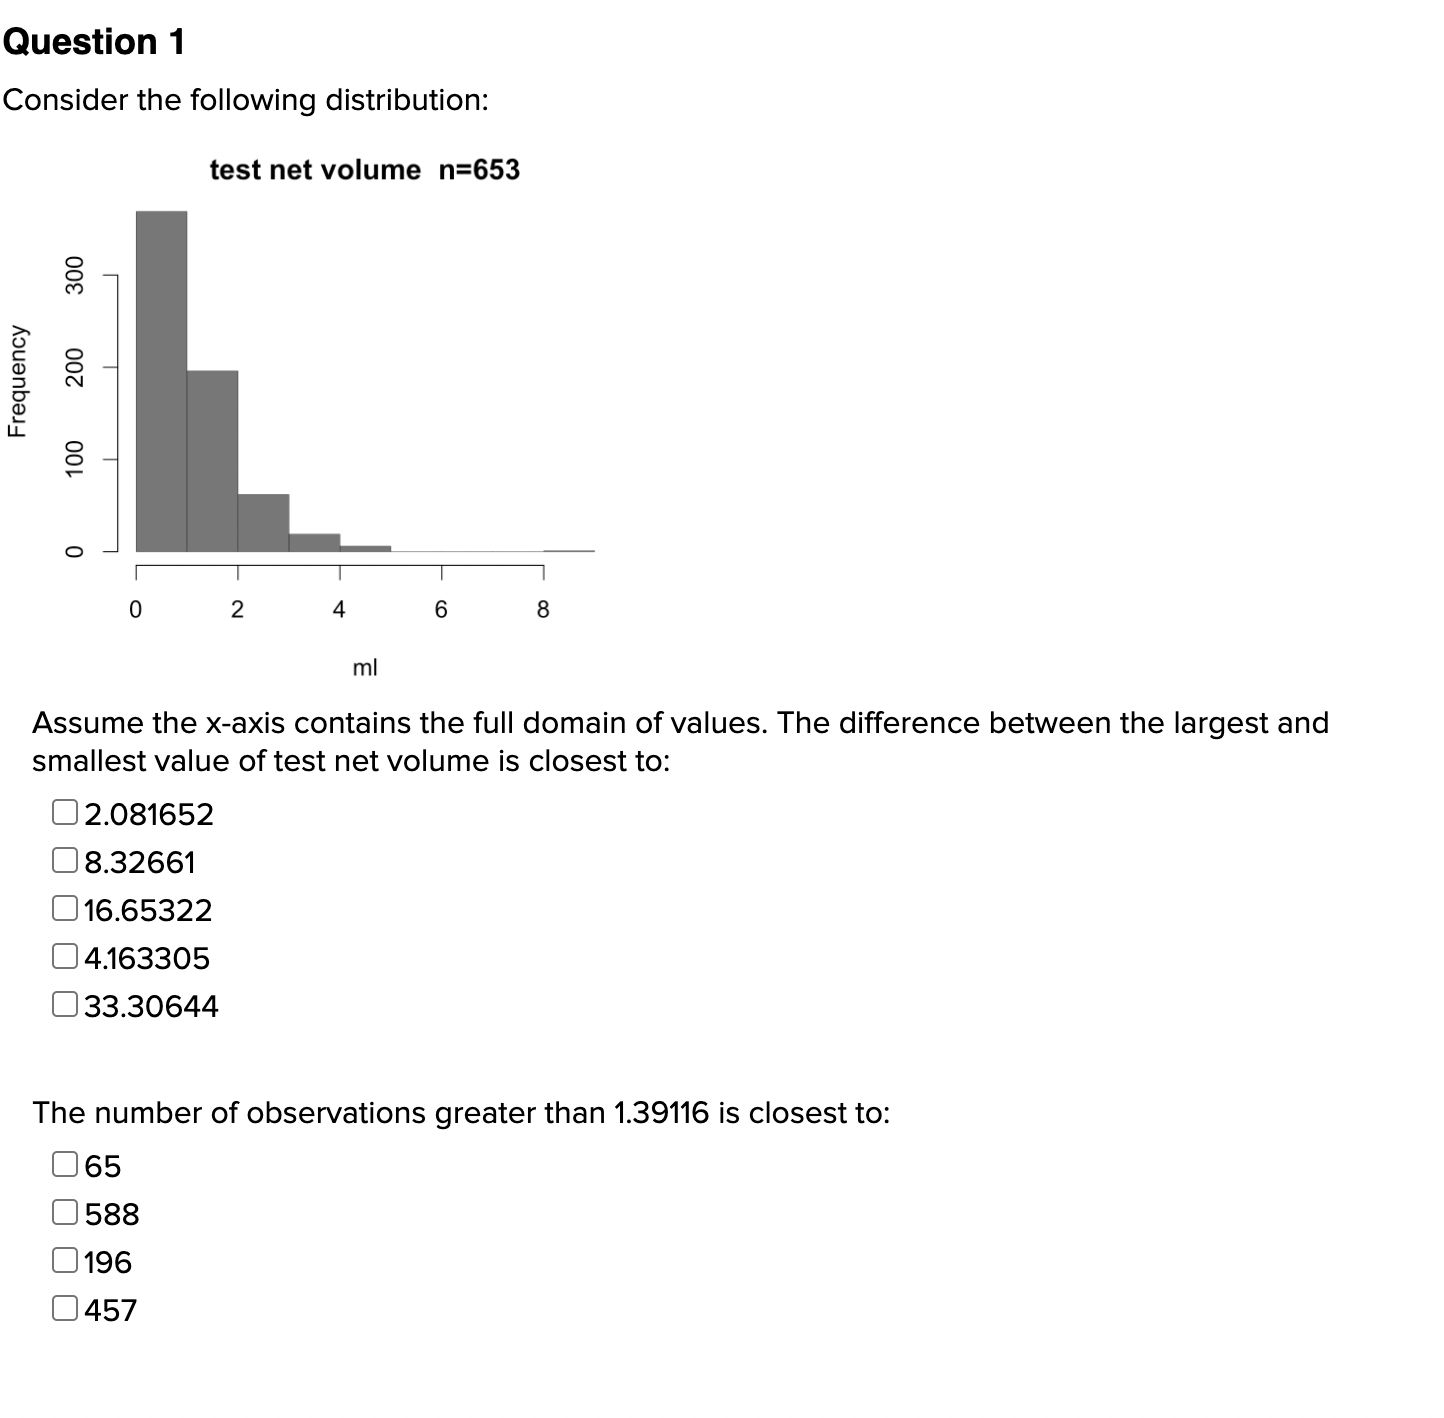
![volume is closest to: C] 2.081652 C] 8.32661 [31665322 [:1 4.163305 C]](https://s3.amazonaws.com/si.experts.images/answers/2024/06/6677ca4fa8878_6076677ca4f7bf7f.jpg)
![33.30644 The number of observations greater than 1.39116 is closest to: C]](https://s3.amazonaws.com/si.experts.images/answers/2024/06/6677ca5023796_6076677ca4ff2beb.jpg)
Question 1 Consider the following distribution: test net volume n=653 200 300 Frequency 100 ml Assume the x-axis contains the full domain of values. The difference between the largest and smallest value of test net volume is closest to: C] 2.081652 C] 8.32661 [31665322 [:1 4.163305 C] 33.30644 The number of observations greater than 1.39116 is closest to: C] 65 C] 588 D196 [:1 457 Question 2 Consider the following distribution: test net volume n=961 o o >\\ N o C 0 a 3 .r 8 o In 0 llllI 20 -15 -10 -5 0 ml Assume the x-axis contains the full domain of values. The difference between the largest and smallest value of test net volume is closest to: C] 83.168289 C] 20.792072 010.396036 C] 41.584145 C] 5.198018 The number of observations greater than 5.98822 is closest to: C] 865 C] 96 C] 288 C] 673 Question 3 Consider the following distribution: test net volume n=915 300 Frequency 50 100 200 0 ml Assume the x-axis contains the full domain of values. The difference between the largest and smallest value of test net volume is closest to: [31.404811 C] 22.476974 011.238487 C] 5.619243 C] 2.809622 The number of observations greater than -O.18409 is closest to: C] 824 C] 91 C] 640 C] 275
Step by Step Solution
There are 3 Steps involved in it

Get step-by-step solutions from verified subject matter experts