

Question: Question 1 Consider the graph below, showing utility in the face of uncertain outcomes (i.e. a gamble). There is a 50% chance of the good
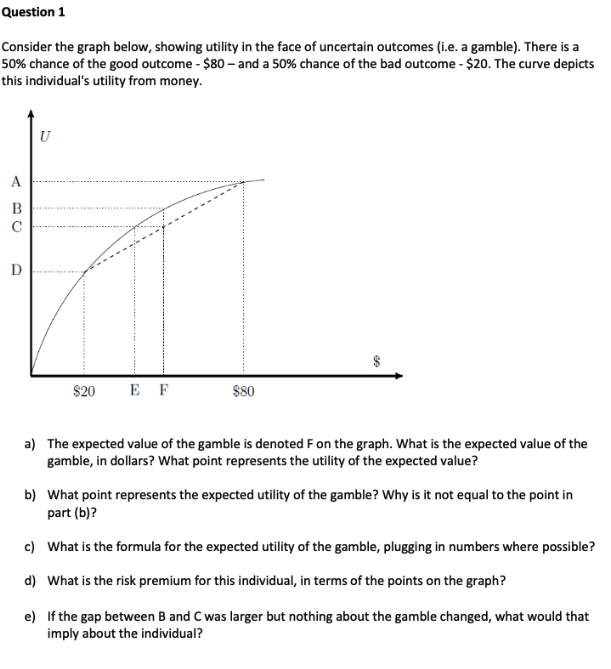
Question 1 Consider the graph below, showing utility in the face of uncertain outcomes (i.e. a gamble). There is a 50% chance of the good outcome - $80 - and a 50% chance of the bad outcome - $20. The curve depicts this individual's utility from money. D $20 EF $80 a) The expected value of the gamble is denoted F on the graph. What is the expected value of the gamble, in dollars? What point represents the utility of the expected value? b) What point represents the expected utility of the gamble? Why is it not equal to the point in part (b)? c) What is the formula for the expected utility of the gamble, plugging in numbers where possible? d) What is the risk premium for this individual, in terms of the points on the graph? e) If the gap between B and C was larger but nothing about the gamble changed, what would that imply about the individual
Step by Step Solution
There are 3 Steps involved in it

Get step-by-step solutions from verified subject matter experts