

Question: QUESTION 1 Consider the horizontal box plot shown below. 0 2 4 6 8 10 12 14 16 a. What is the median of
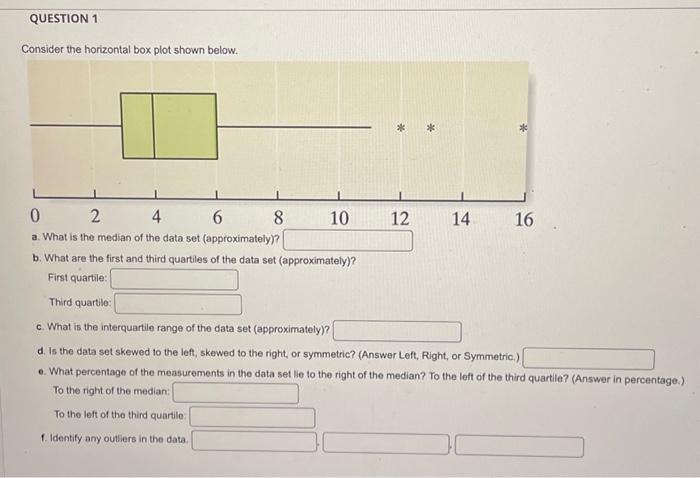
QUESTION 1 Consider the horizontal box plot shown below. 0 2 4 6 8 10 12 14 16 a. What is the median of the data set (approximately)? b. What are the first and third quartiles of the data set (approximately)? First quartile: Third quartile: c. What is the interquartile range of the data set (approximately)? d. Is the data set skewed to the left, skewed to the right, or symmetric? (Answer Left, Right, or Symmetric.) e. What percentage of the measurements in the data set lie to the right of the median? To the left of the third quartile? (Answer in percentage.) To the right of the median: To the left of the third quartile: f. Identify any outliers in the data.
Step by Step Solution
There are 3 Steps involved in it

Get step-by-step solutions from verified subject matter experts