

Question: Question 1 . Consider the search chart shown at right. S is the starting node and G is the target node. The edges are explained
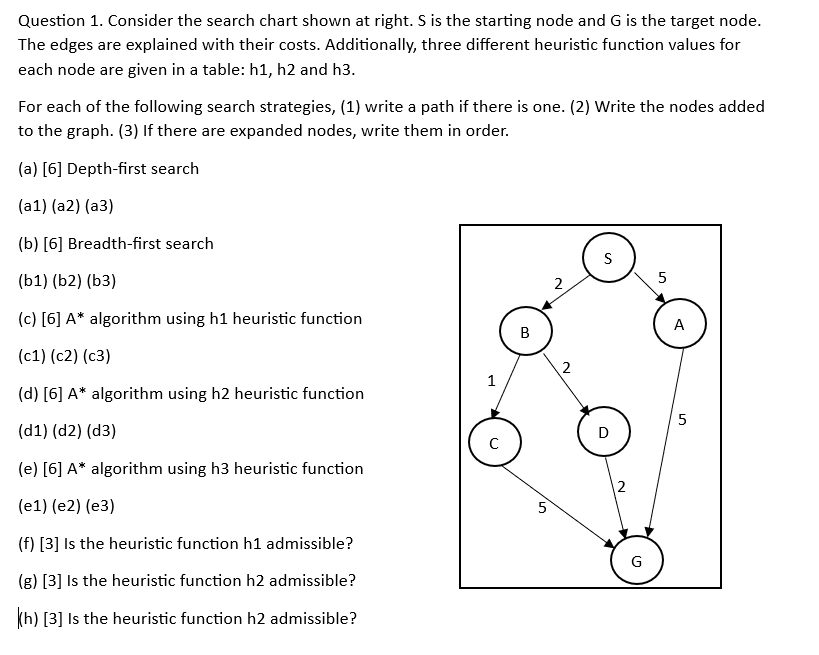
Question Consider the search chart shown at right. S is the starting node and G is the target node.
The edges are explained with their costs. Additionally, three different heuristic function values for
each node are given in a table: h h and h
For each of the following search strategies, write a path if there is one. Write the nodes added
to the graph. If there are expanded nodes, write them in order.
a Depthfirst search
aaa
b Breadthfirst search
bbb
c A algorithm using h heuristic function
ccc
d A algorithm using h heuristic function
ddd
e A algorithm using h heuristic function
eee
f Is the heuristic function h admissible?
g Is the heuristic function h admissible?
h Is the heuristic function h admissible?
Step by Step Solution
There are 3 Steps involved in it
1 Expert Approved Answer
Step: 1 Unlock

Question Has Been Solved by an Expert!
Get step-by-step solutions from verified subject matter experts
Step: 2 Unlock
Step: 3 Unlock