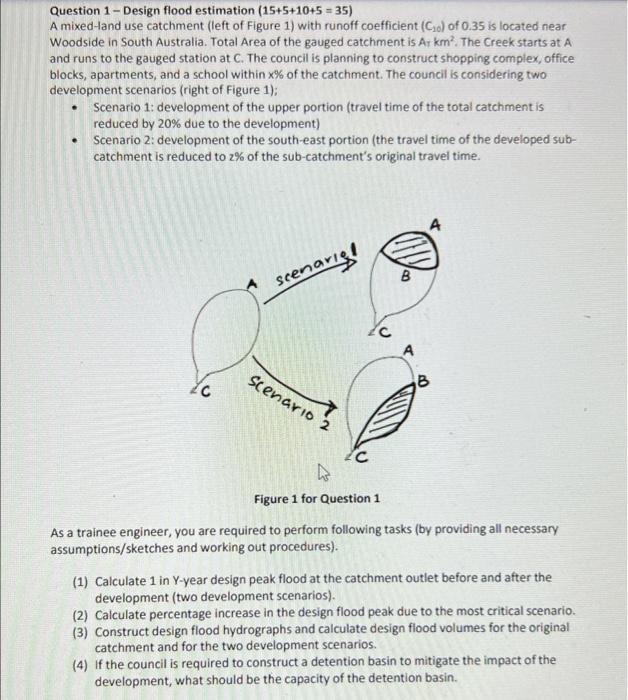
Question: Question 1- Design flood estimation (15+5+10+5 = 35) A mixed-land use catchment (left of Figure 1) with runoff coefficient (Co) of 0.35 is located near

Question 1- Design flood estimation (15+5+10+5 =
Question 1- Design flood estimation (15+5+10+5 = 35) A mixed-land use catchment (left of Figure 1) with runoff coefficient (Co) of 0.35 is located near Woodside in South Australia. Total Area of the gauged catchment is Ar km. The Creek starts at A and runs to the gauged station at C. The council is planning to construct shopping complex, office blocks, apartments, and a school within x% of the catchment. The council is considering two development scenarios (right of Figure 1); . Scenario 1: development of the upper portion (travel time of the total catchment is reduced by 20% due to the development) Scenario 2: development of the south-east portion (the travel time of the developed sub- catchment is reduced to 2% of the sub-catchment's original travel time. scenarie Scenario 2 C B A Figure 1 for Question 1 As a trainee engineer, you are required to perform following tasks (by providing all necessary assumptions/sketches and working out procedures). (1) Calculate 1 in Y-year design peak flood at the catchment outlet before and after the development (two development scenarios). (2) Calculate percentage increase in the design flood peak due to the most critical scenario. (3) Construct design flood hydrographs and calculate design flood volumes for the original catchment and for the two development scenarios. (4) if the council is required to construct a detention basin to mitigate the impact of the development, what should be the capacity of the detention basin. Select design parameters from Table 1 using the seventh digit of your student ID for your analyses/investigation. The IFD data for the Woodside station is given in Figure 3 and Frequency conversion factor is given in Table 3. S T U D 4 1 0 1 Table 1: Design parameters for Question 1 7th digit of student ID Total catchment area (AT) % area development (X) 20 2 3 4 5 6 7 8 2 9 30 40 50 20 30 40 50 40 0 50 20 30 40 50 50 40 30 20 50 40 E 1 Page 2 of 6 2 Y for AEP (1 in Y) 5 20 50 100 2 5 20 N 50 100 3 T 2 % of original travel time (2) 80 70 8828 60 80 70 60 80 70 60 80 I 8 0.6 Cie (developed) 0.7 0.8 0.6 0.7 0.8 0.6 0.7 0.8 D 0.6 7 3

Step by Step Solution

There are 3 Steps involved in it

1 Expert Approved Answer
Step: 1 Unlock blur-text-image
Question Has Been Solved by an Expert!

Get step-by-step solutions from verified subject matter experts

Step: 2 Unlock
Step: 3 Unlock

Students Have Also Explored These Related General Management Questions!