

Question: Question 1: For a country X producing only two products, A and B; when other things remain equal, points along the country's production possibilities frontier
Question 1:
For a country X producing only two products, A and B; when other things remain equal, points along the country's production possibilities frontier (PPF) can be used to show which of the following?
Question 1 options:
The opportunity cost of producing product A but not the opportunity cost of producing one unit of B.
The opportunity cost of producing product B but not the opportunity cost of producing one unit of A.
The opportunity cost of producing product only one product (i.e., A or B), but not the other.
None of the above.
Question 2 (0.325 points) All Rights Reserved for Dr. Ibrahim Abou-Saad:
Figure 15.1.Final Exam
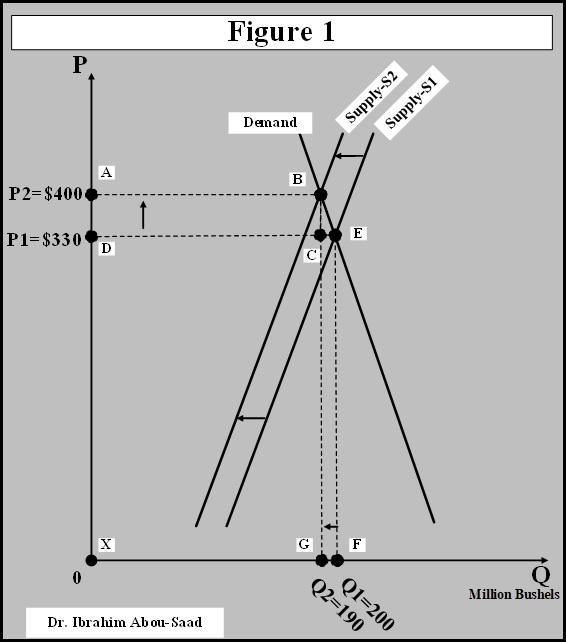
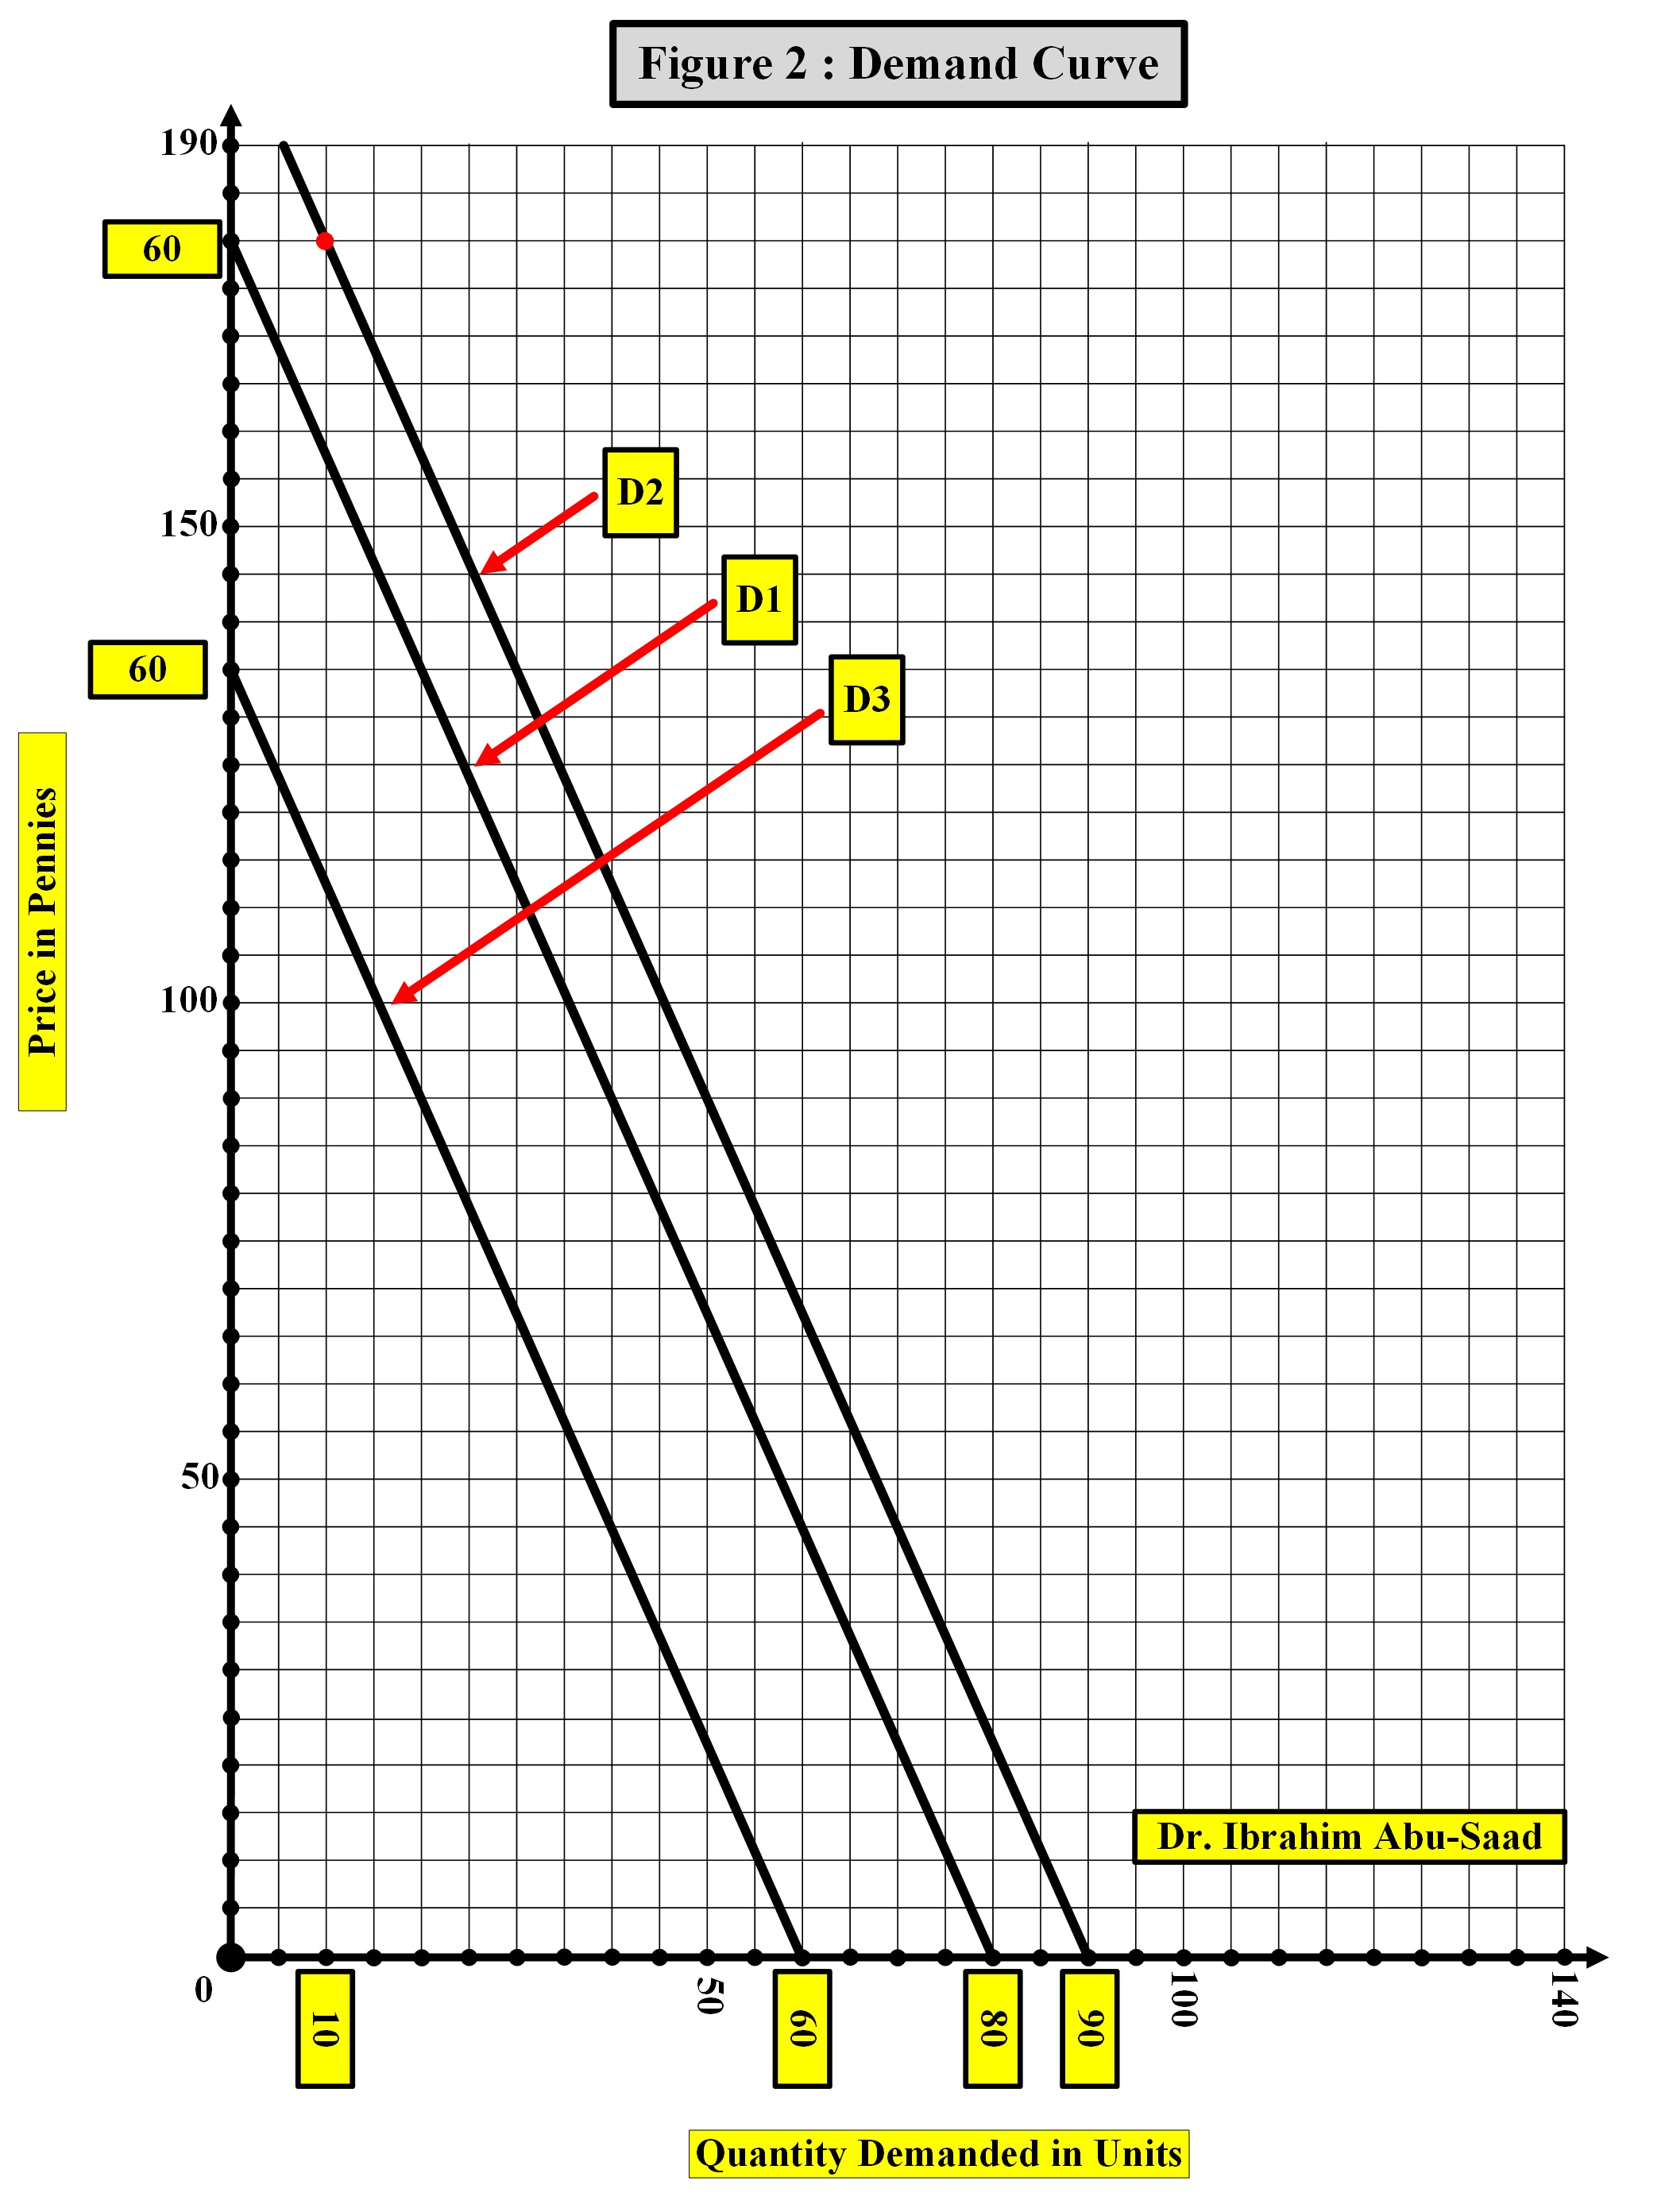
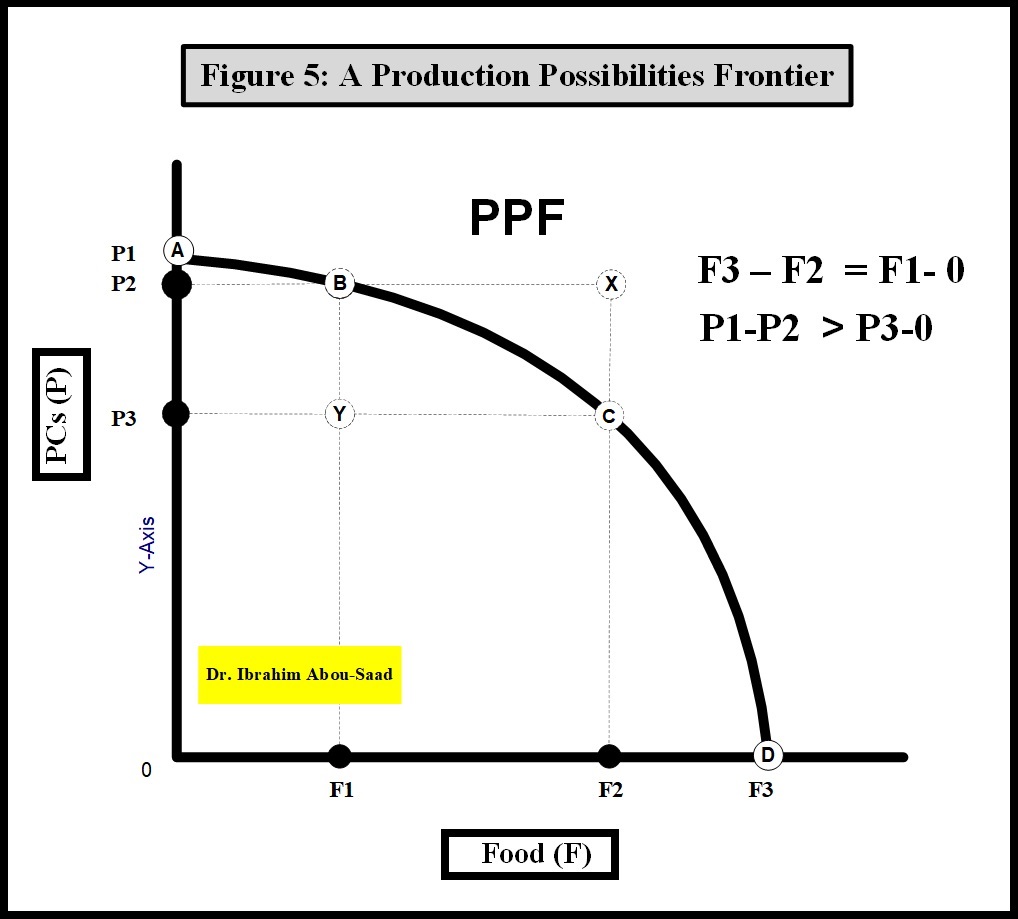
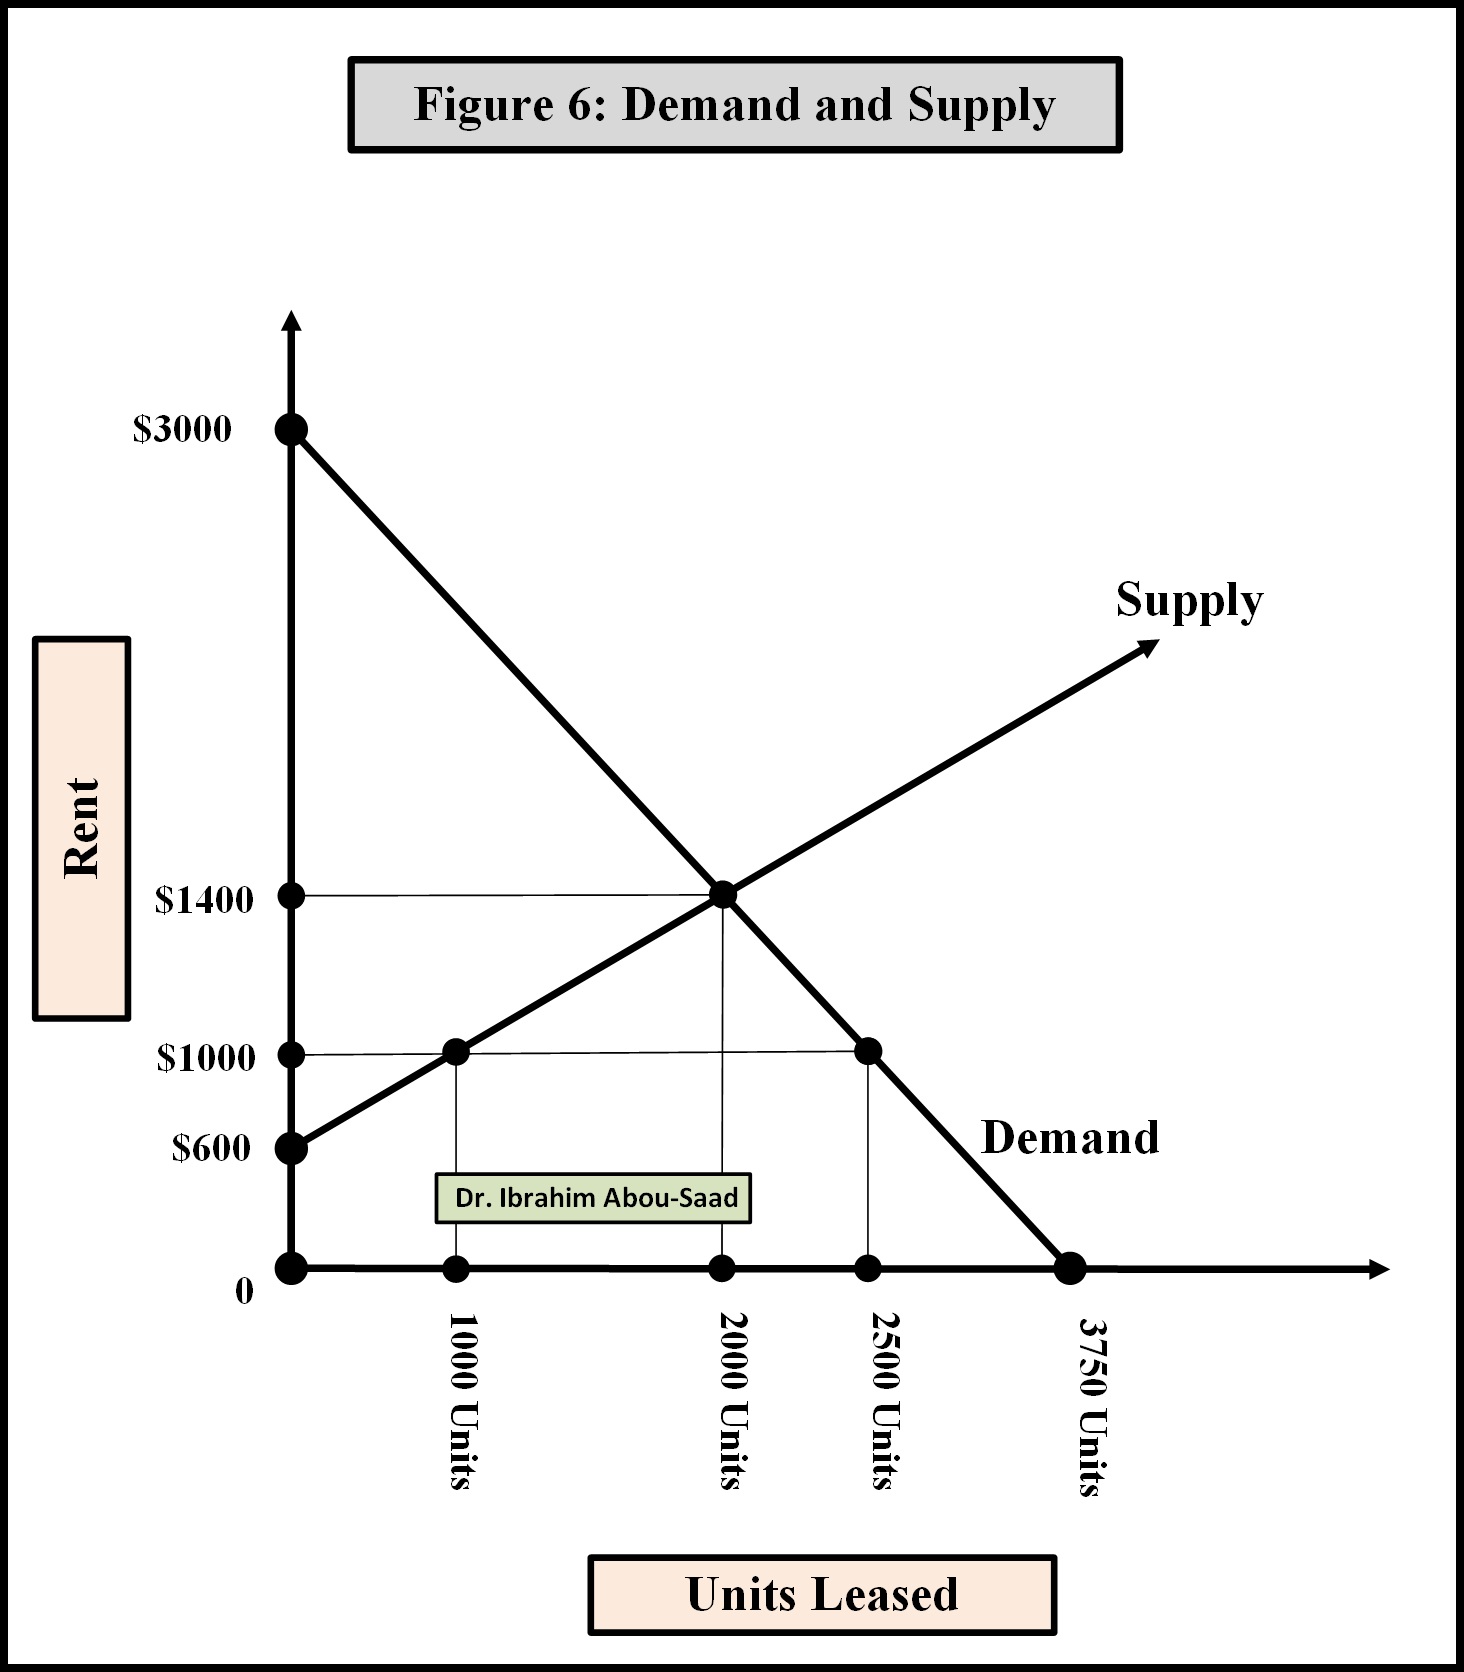
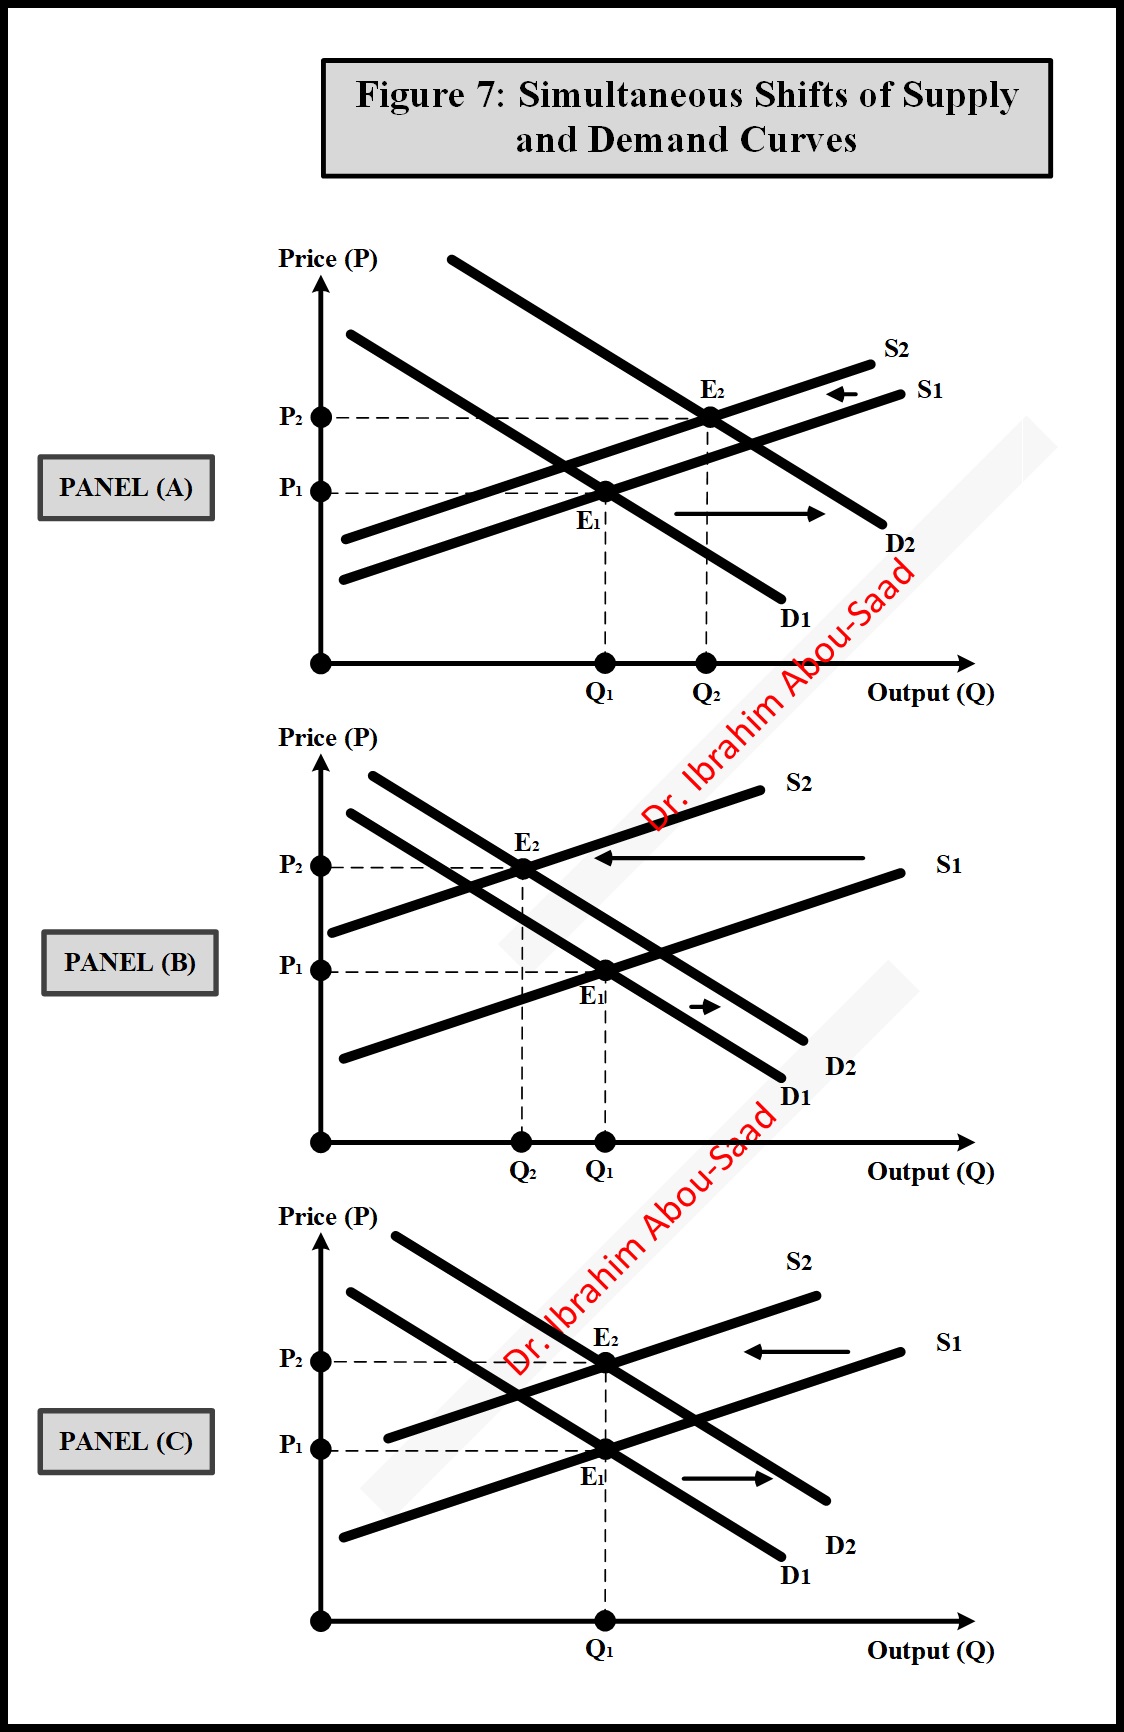
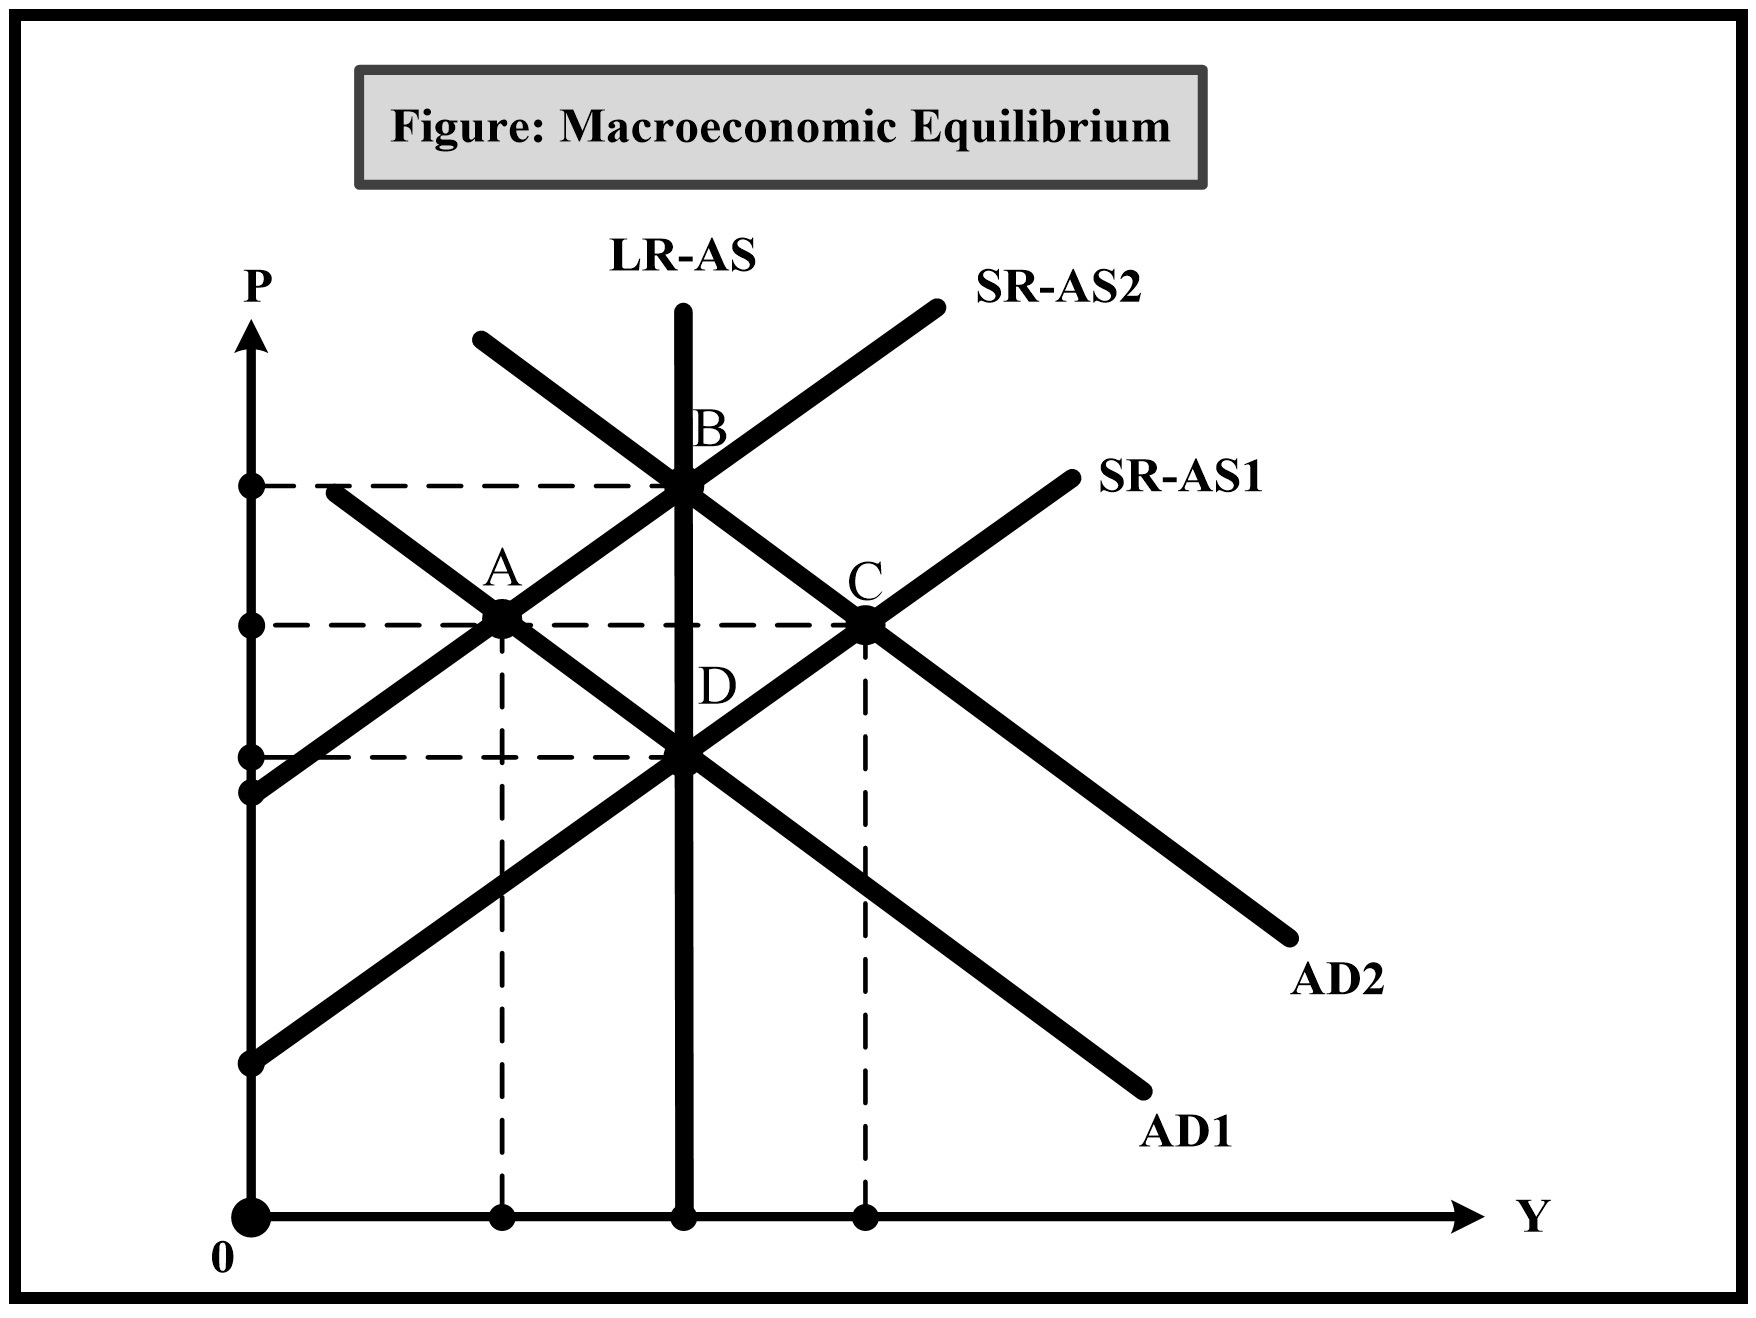
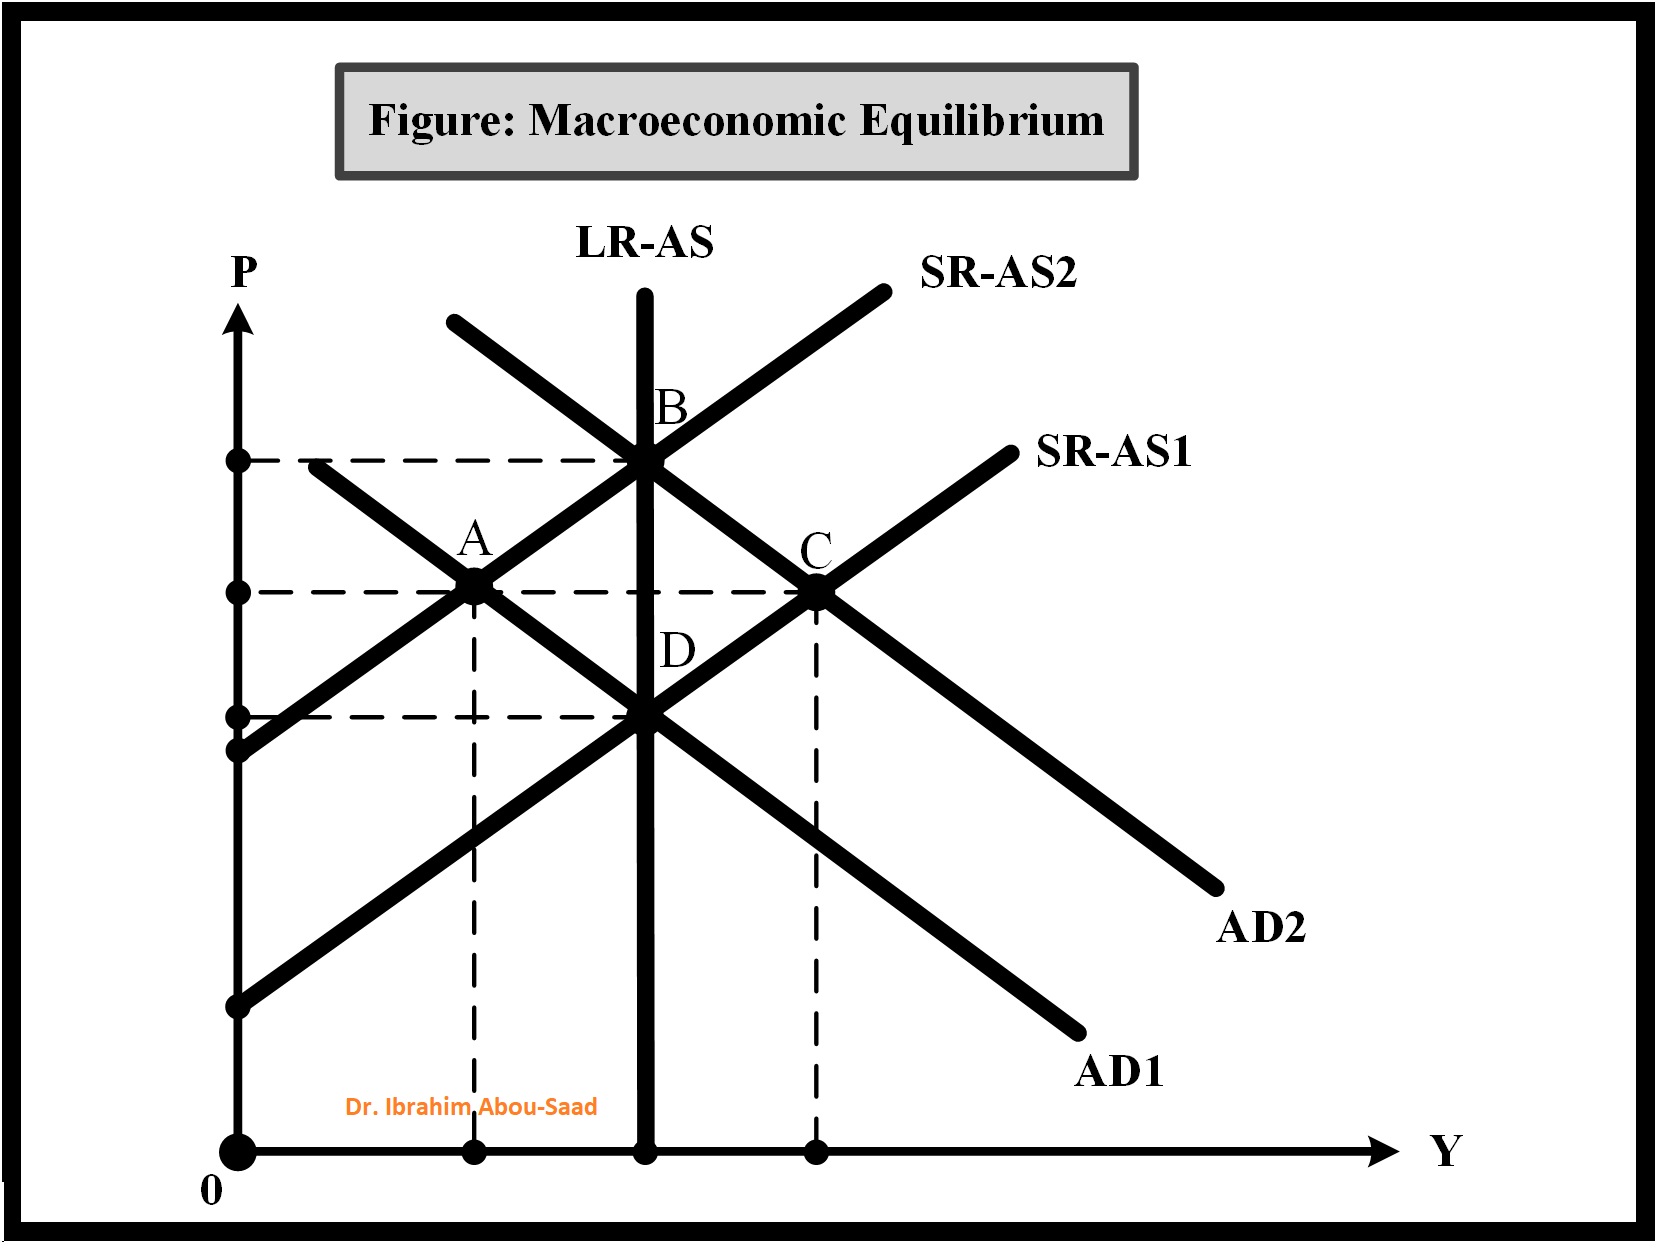
Figure 1 P Supply- Supply-$1 Demand A B P2=$400 P1=$330 E D X G F Million Bushels Q1=200 Q2=190 Dr. Ibrahim Abou-SaadFigure 2 : Demand Curve 1901 60 D2 150 D1 60 D3 Price in Pennies 100 50 Dr. Ibrahim Abu-Saad OOT 140 2 Quantity Demanded in Units\fFigure 5: A Production Possibilities Frontier PPF P1 A P2 B X F3 - F2 = F1-0 P1-P2 > P3-0 PCs (P) P3 Y-Axis Dr. Ibrahim Abou-Saad D 0 F1 F2 F3 Food (F)Figure 6: Demand and Supply $3000 Supply Rent $1400 $1000 $600 Demand Dr. Ibrahim Abou-Saad 0 1000 Units 2000 Units 2500 Units 3750 Units Units LeasedFigure 7: Simultaneous Shifts of Supply and Demand Curves Price (P) PANEL (A) Price (P) PANEL (B) Output (Q) Price (P) Output (Q) Figure: Macroeconomic Equilibrium LR-AS SR-AS2 B SR-AS1 A C ID - - - AD2 AD1 Y 0Figure: Macroeconomic Equilibrium LR-AS SR-AS2 B SR-AS1 A C D - - - - -. AD2 - - AD1 Dr. Ibrahim, Abou-Saad Y 0
Step by Step Solution
There are 3 Steps involved in it

Get step-by-step solutions from verified subject matter experts