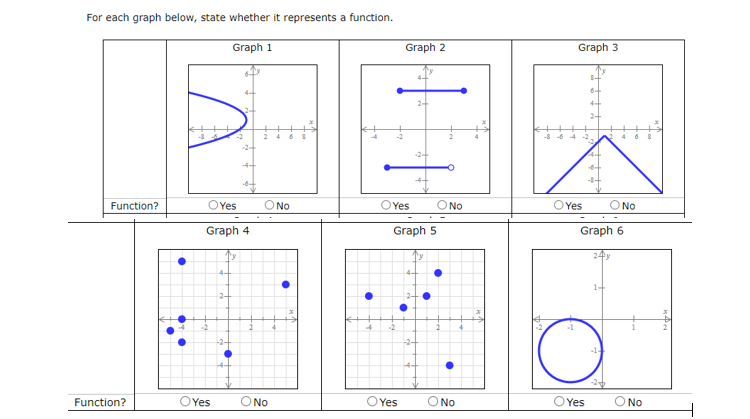
Question: question 1 For each graph below, state whether it represents a function. Graph 1 Graph 2 Graph 3 O NO OYes ONO OYes ONO Function?
question 1
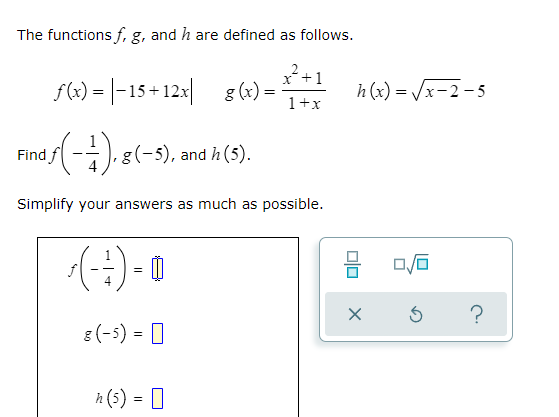
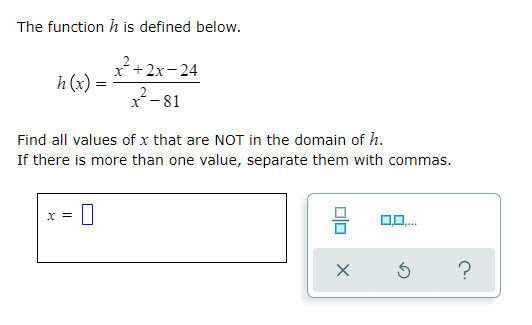
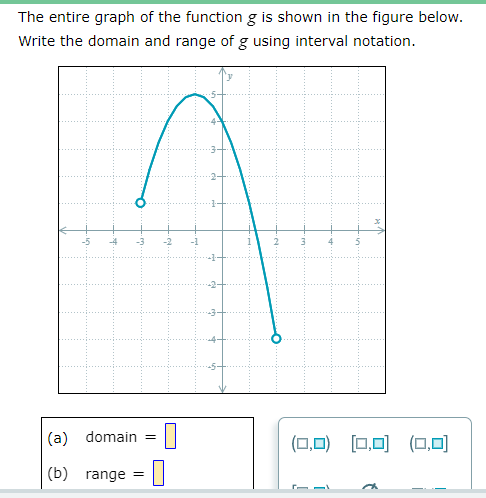
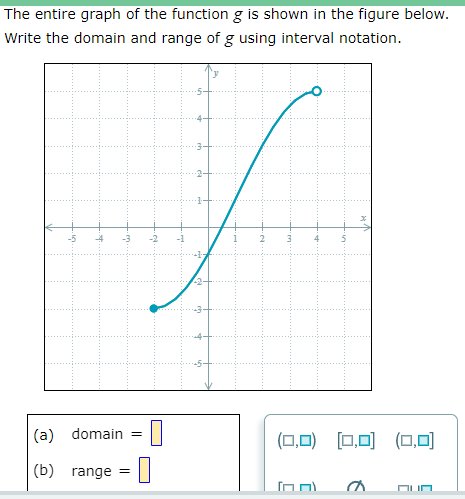
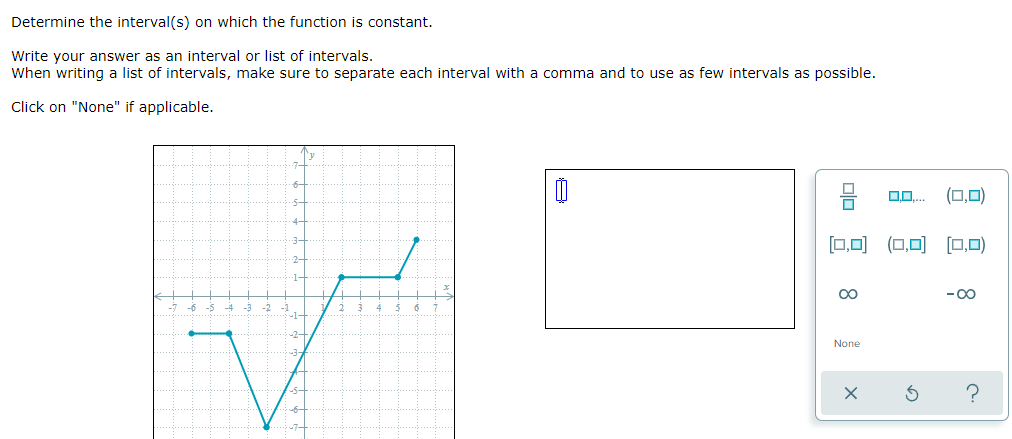
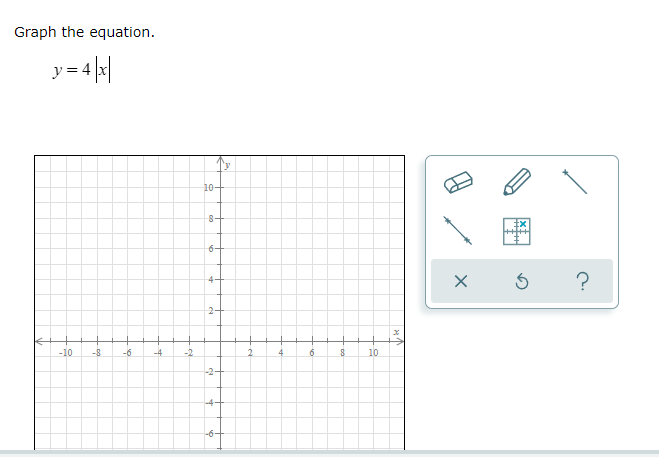
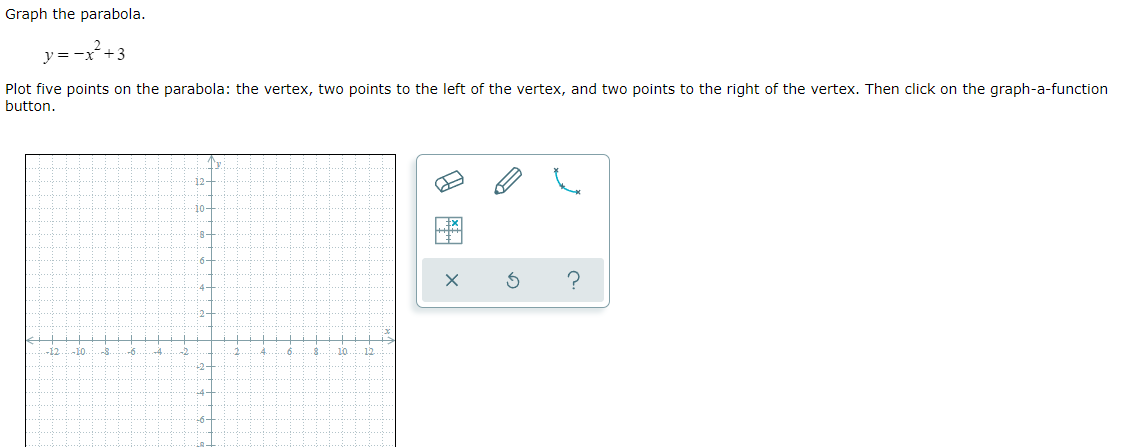
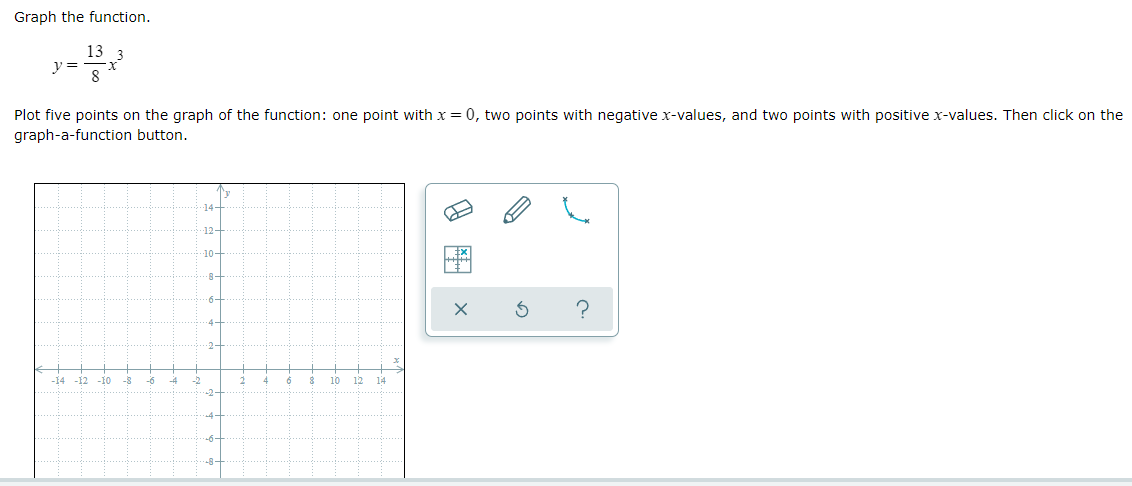
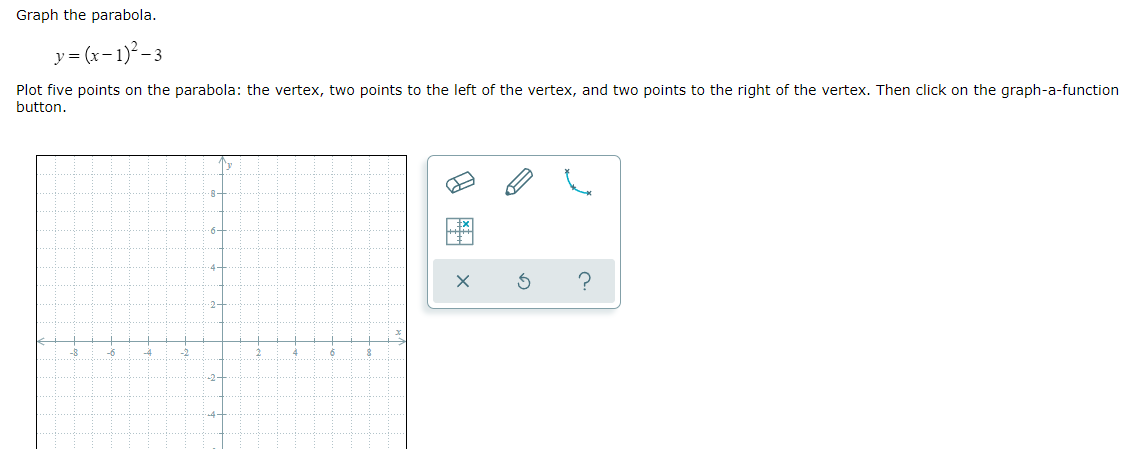
For each graph below, state whether it represents a function. Graph 1 Graph 2 Graph 3 O NO OYes ONO OYes ONO Function? OYes Graph 5 Graph 6 Graph 4 Ty 1-J 2- -3- O No OYes OYes O No OYes Function? ONOThe functions f, g, and h are defined as follows. x+1 f(x) = -15 +12x| g(x) = h (x) =vx-2-5 1+x Find f 4 J. 8(-5), and h (5). Simplify your answers as much as possible. 4 X 5 ? 8 (-5) = 0 h (5 ) = 0The function h is defined below. 2 X + 2x -24 h (x) = 2 x- 81 Find all values of x that are NOT in the domain of h. If there is more than one value, separate them with commas. = 0.0 X 5 ?The entire graph of the function g is shown in the figure below. Write the domain and range of g using interval notation. . . i . . . .!. . . . . . . . . . .".. . . . . . .. . . .. . . . . .. . . . . . . . ! . . . . . . . . .. . ". ...... . . . . . . (a) domain = (0,0) [0,0] (0,0] (b) range =The entire graph of the function g is shown in the figure below. Write the domain and range of g using interval notation. . ! . . . . . . . . . . . . . . I . . . . . . ...... . . .. . UJ. . . . . ." . .... ." . . . . . I . . . . . . . . .". . . . (a) domain = (0,0) [0,0] (0,0] (b) range = mi inDetermine the interval(s) on which the function is constant. Write your answer as an interval or list of intervals. When writing a list of intervals, make sure to separate each interval with a comma and to use as few intervals as possible. Click on "None" if applicable. % I:i,i:|,... (I:I,I:I) [ELIE] (EI.E|] [BLED oo 00 None Graph the equation. y =4 x 10- 6 - 4- X 5 ? 2- -10 -3 -6 -2- 4- -6-Graph the parabola. y = x2+ 3 Plot ve points on the parabola: the vertex, two points to the left of the vertex, and two points to the right of the vertex. Then click on the graphafunction button. Graph the function. = x y 8 Plot five points on the graph of the function: one point with x = 0, two points with negative xvalues, and two points with positive xvalues. Then click on the graphafunction button. Graph the parabola. y=(x1)23 Plot five points on the parabola: the vertex, two points to the left of the vertex, and two points to the right of the vertex. Then click on the graphafunction button
Step by Step Solution
There are 3 Steps involved in it
1 Expert Approved Answer
Step: 1 Unlock
Question Has Been Solved by an Expert!
Get step-by-step solutions from verified subject matter experts
Step: 2 Unlock
Step: 3 Unlock
Students Have Also Explored These Related Mathematics Questions!