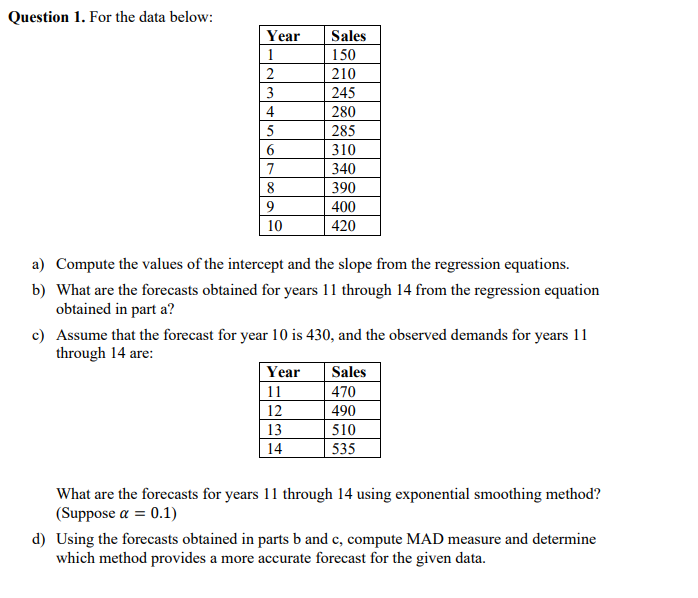
Question: Question 1. For the data below: Year 1 2 3 4 5 6 7 8 Sales 150 210 245 280 285 310 340 390 400

Question 1. For the data below: Year 1 2 3 4 5 6

Question 1. For the data below: Year 1 2 3 4 5 6 7 8 Sales 150 210 245 280 285 310 340 390 400 420 9 10 a) Compute the values of the intercept and the slope from the regression equations. b) What are the forecasts obtained for years 11 through 14 from the regression equation obtained in part a? c) Assume that the forecast for year 10 is 430, and the observed demands for years 11 through 14 are: Year Sales 11 470 12 490 13 510 14 535 What are the forecasts for years 11 through 14 using exponential smoothing method? (Suppose a = 0.1) d) Using the forecasts obtained in parts b and c, compute MAD measure and determine which method provides a more accurate forecast for the given data

Step by Step Solution

There are 3 Steps involved in it

1 Expert Approved Answer
Step: 1 Unlock blur-text-image
Question Has Been Solved by an Expert!

Get step-by-step solutions from verified subject matter experts

Step: 2 Unlock
Step: 3 Unlock

Students Have Also Explored These Related General Management Questions!