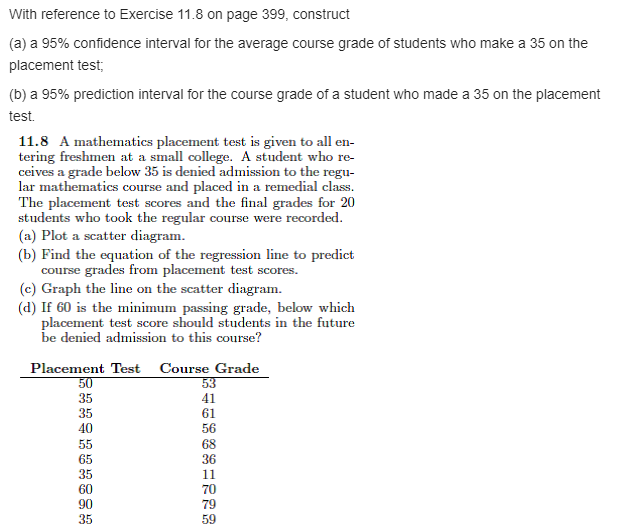
Question: Question 1: For the data in Exercise 11.29, nd a 95% predioljon interval at I = 25. 11.29 USE the data set 3; m 7
Question 1:
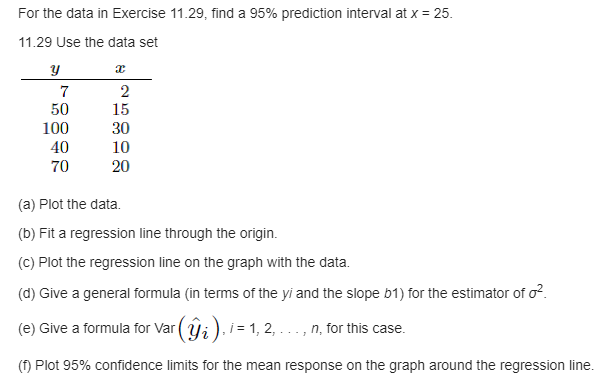
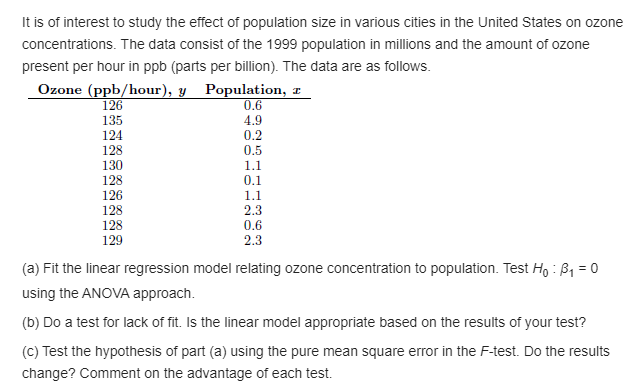
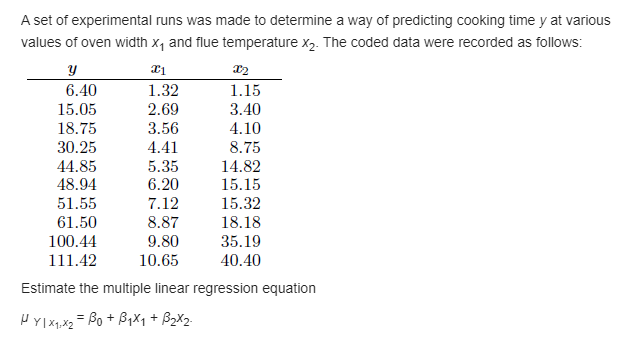
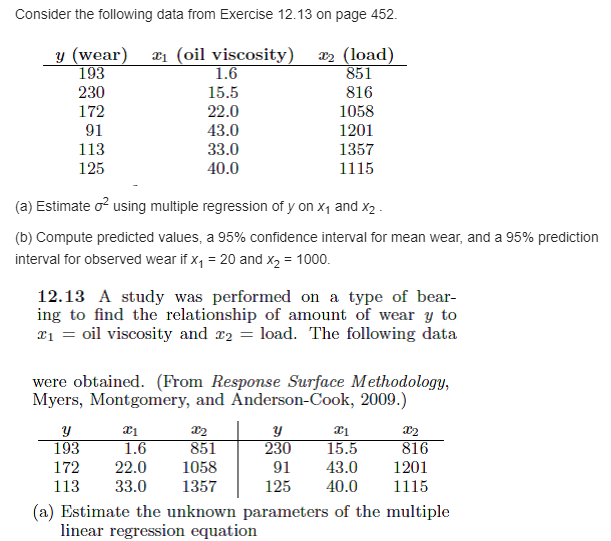
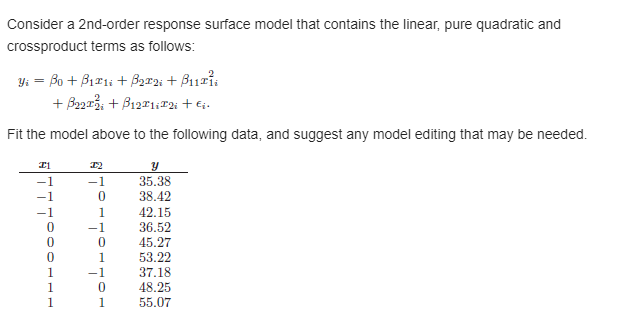
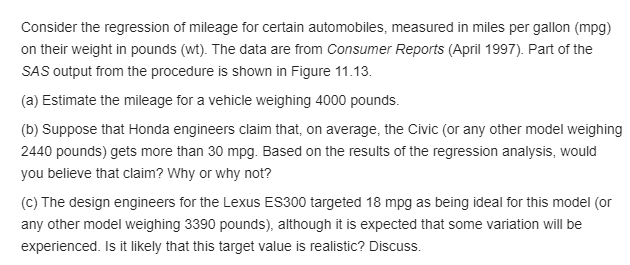
For the data in Exercise 11.29, nd a 95% predioljon interval at I = 25. 11.29 USE the data set 3; m 7 2 5D 1 5 IUD 3E} 4D 10 7U 2G {3} Plot the data. {h} Fit a regression line through the origin. (of: Plot the regression line on the graph with the data. {d} Ghre a general formula {in terms of the 1d and the slope 11} for the estimator of 02. {e} Ghre a formula forVar('yi), i= 1, 2, . . _ , n, for this case. if} Plot 95% condence limits for the mean response on the graph around the regression line. It is of interest to stud}:r the effect of population size in 'lu'Ell'iDUS cities in the United States on ozone concentrations. The data consist of the 1399 population in millions and the amount of ozone present per hour in ppo {parts per billion}. The data are as follows. Ozone {ppbghour}, y Population, 3 126 0.6 135 4.9 12-4 0.2 123 0.5 13D 1.1 128 Ill 126 1.1 128 2.3 128 0.6 129 2.3 {a} Fit the linear regression model relating ozone concentration to population. Test Ho : 131 = D using the ANDVA approach. {o} [lo a test for lack of t. Is the linear model appropriate based on the results of your test? {c} Test the hypothesis of part {a} using the pure mean square error in the Ftest. Do the results change?I Comment on the advantage of each test. A set of experimental runs was made to determine a way of predicting cooking time y at various values of oven width x, and flue temperature x2. The coded data were recorded as follows: y 6.40 1.32 1.15 15.05 2.69 3.40 18.75 3.56 4.10 30.25 4.41 8.75 44.85 5.35 14.82 48.94 6.20 15.15 51.55 7.12 15.32 61.50 8.87 18.18 100.44 9.80 35.19 111.42 10.65 40.40 Estimate the multiple linear regression equation HYlx x2 = Bot BqX1 + 32X2Consider the following data from Exercise 12.13- on page 452. y (wear) 31 {oil viscosity) a}: [load] 103 1.5 351 230 15.5 310 17'? 22.0 1053 01 43.0 1201 1 13 33.0 135? 125 40.0 1 1 15 {a} Estimate 02 using multiple regression of F on x1 and r2 _ {o} Compute predicted values, a 95% condence interval for mean wear, and a 95% prediction interval for observed wear if I, = 20 and x2 = moo. 12.13 A stud}; was performed on a. type of hear ing to nd the relationship of amount of wear 1: to on 2 oil viscosity.r and 1'2 2 load. The following data were obtained. {Pi-om Response Surface Methodology, Myers, Montgomery, and AndersonCook, 2000.) y 31 '32 y 31 312 103 1.5 351 230 15.5 815 172 22.0 11153 91 43.0 1201 113 33.0 1357r 125 40.0 1115 (a) Estimate the unknown parameters of the multiple linear regression equation \fConsider a 2nd-order response surface model that contains the linear, pure quadratic and crossproduct terms as follows: 2 y. = n + .31311- + .3232.- + .31111a + .52421'5. + 31:31:12..- + Ea. Fit the model above to the followi ng data, and suggest an}:r model editing that may he needed. 1'1 1': y 1 l 35.33 1 l] 33.42 1 l 42.15 I] l 35.52 I] E] 45.2? I] l 53.22 1 l 3?.13 1 l] 43.25 1 1 55.0? Consider the regression of mileage for certain automobiles, measured in miles per gallon [mpg]: on their weight in pounds (wt). The data are from Consumer Reports {April 193?}. Part otthe SASoutput ti'om the procedure is shown in Figure 11.13. {a} Estimate the mileage for a vehicle weighing 4ooo pounds. {on} Suppose that Honda engineers claim that, on average, the 'Civic {oranv other model weighing 244D pounds} gets more than 30 mpg. Based on the results otthe regression analvsis, would 'fCIU believe that claim? Why or whv not? {c} The design engineers for the Lexus E3300 targeted 18 mpg as being ideal for this model [or any.r other model weighing 3390 pounds}, although it is expected that some variation will be experienced. IS it likely that this target value is realistic? Discuss