

Question: Question 1.) For the following Table A answer part a,b:- Table A Number of Workers TP MP AP 1 10 2 80 3 180
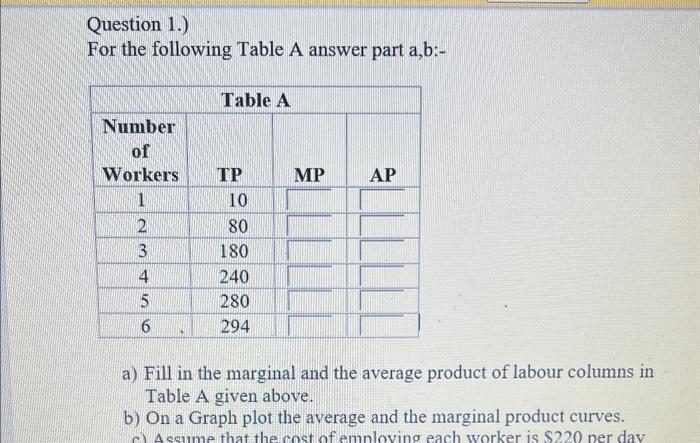
Question 1.) For the following Table A answer part a,b:- Table A Number of Workers TP MP AP 1 10 2 80 3 180 4 240 5 280 6 294 a) Fill in the marginal and the average product of labour columns in Table A given above. b) On a Graph plot the average and the marginal product curves. c) Assume that the cost of employing each worker is $220 per day
Step by Step Solution
There are 3 Steps involved in it
1 Expert Approved Answer
Step: 1 Unlock

Question Has Been Solved by an Expert!
Get step-by-step solutions from verified subject matter experts
Step: 2 Unlock
Step: 3 Unlock