

Question: QUESTION 1 For the system shown in figure, determine the most critical cross section. Draw the distribution of normal stress within this crosssection. DATA GIVEN
QUESTION
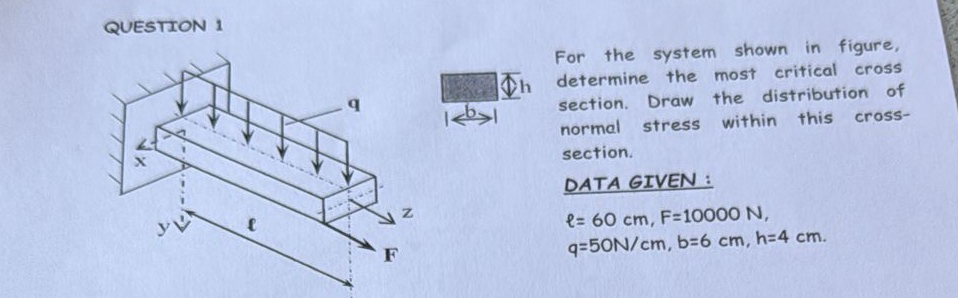
For the system shown in figure, determine the most critical cross section. Draw the distribution of normal stress within this crosssection.
DATA GIVEN :
Step by Step Solution
There are 3 Steps involved in it
1 Expert Approved Answer
Step: 1 Unlock

Question Has Been Solved by an Expert!
Get step-by-step solutions from verified subject matter experts
Step: 2 Unlock
Step: 3 Unlock