

Question: Question 1. For this question use the Auto data set from the ISLR package. To access this data set first install the package using install.packages
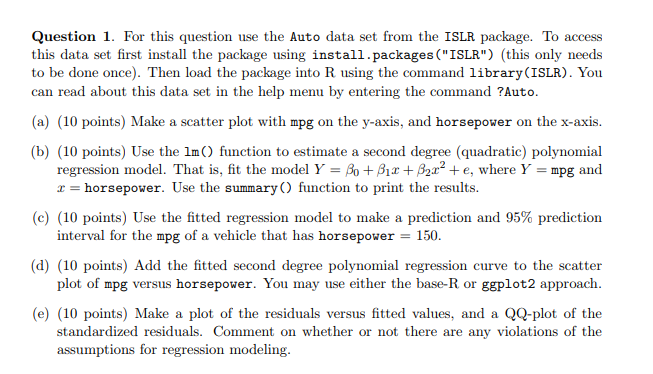
Question 1. For this question use the Auto data set from the ISLR package. To access this data set first install the package using install.packages ("ISLR") (this only needs to be done once). Then load the package into R using the command library (ISLR). You can read about this data set in the help menu by entering the command ?Auto (a) (10 points) Make a scatter plot with mpg on the y-axis, and horsepower on the x-axis (b) (10 points) Use the 1m) function to estimate a second degree (quadratic) polynomial regression model. That is, fit the model Y-A-+Ax + 2x2 + e, where Y-mpg and r horsepower. Use the summary) function to print the results (c) (10 points) Use the fitted regression model to make a prediction and 95% prediction interval for the mpg of a vehicle that has horsepower 150 (d) (10 points) Add the fitted second degree polynomial regression curve to the scatter plot of mpg versus horsepower. You may use either the base-R or ggplot2 approach (e) (10 points) Make a plot of the residuals versus fitted values, and a QQ-plot of the residuals. Comment on whether or not there are any violations of the assumptions for regression modeling Question 1. For this question use the Auto data set from the ISLR package. To access this data set first install the package using install.packages ("ISLR") (this only needs to be done once). Then load the package into R using the command library (ISLR). You can read about this data set in the help menu by entering the command ?Auto (a) (10 points) Make a scatter plot with mpg on the y-axis, and horsepower on the x-axis (b) (10 points) Use the 1m) function to estimate a second degree (quadratic) polynomial regression model. That is, fit the model Y-A-+Ax + 2x2 + e, where Y-mpg and r horsepower. Use the summary) function to print the results (c) (10 points) Use the fitted regression model to make a prediction and 95% prediction interval for the mpg of a vehicle that has horsepower 150 (d) (10 points) Add the fitted second degree polynomial regression curve to the scatter plot of mpg versus horsepower. You may use either the base-R or ggplot2 approach (e) (10 points) Make a plot of the residuals versus fitted values, and a QQ-plot of the residuals. Comment on whether or not there are any violations of the assumptions for regression modeling
Step by Step Solution
There are 3 Steps involved in it

Get step-by-step solutions from verified subject matter experts