

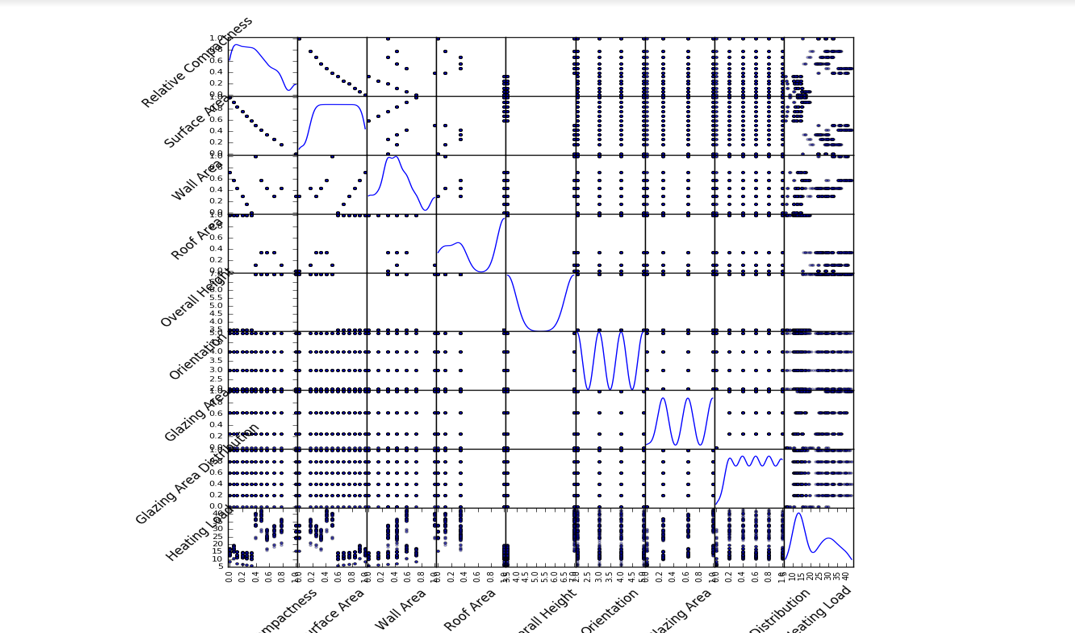
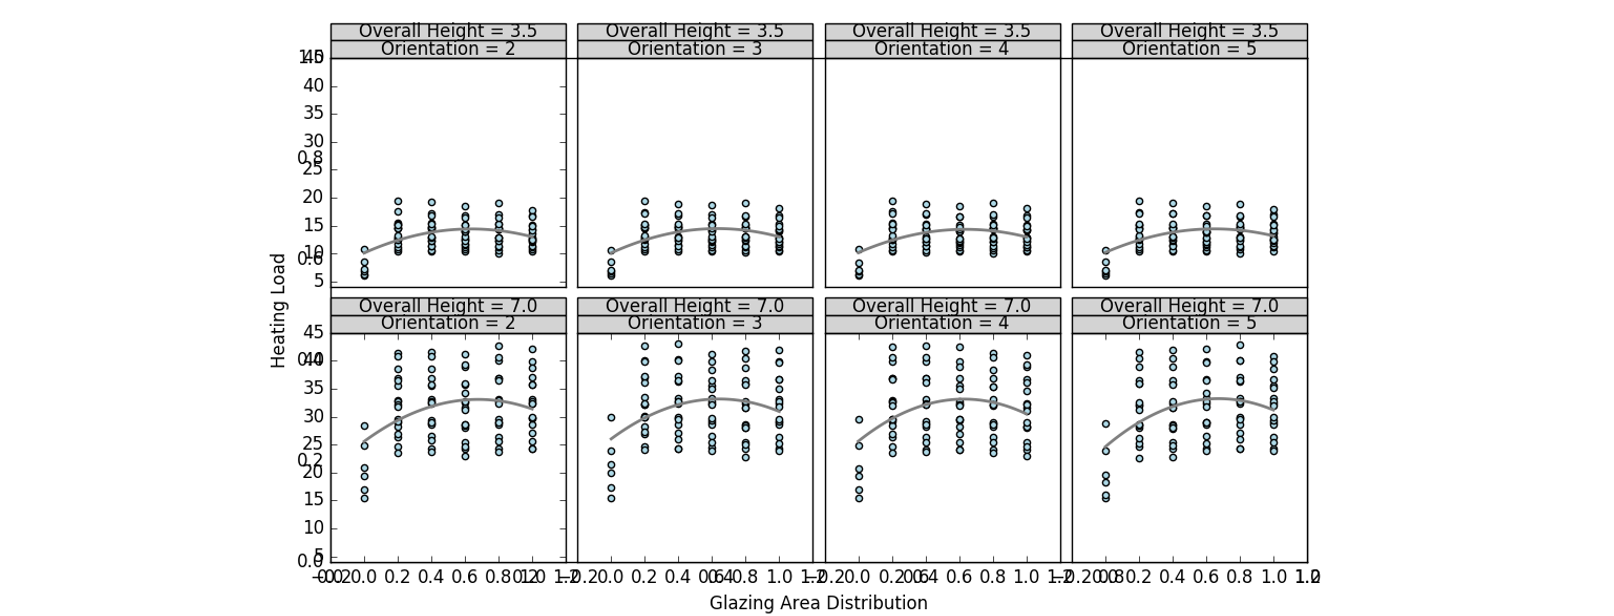
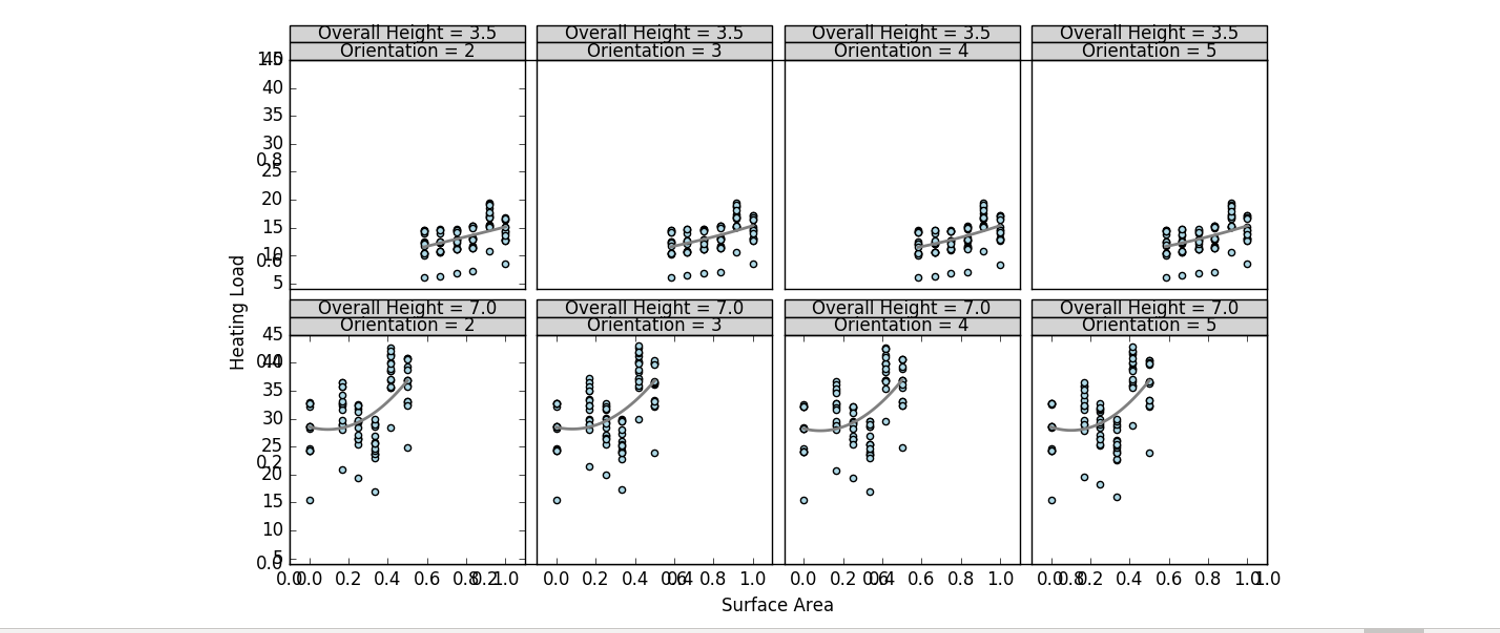
Question: Question 1 : from the graphs on the top Take a screenshot of the scatter plot showing Relative Compactness versus Heating Load. Look closely at
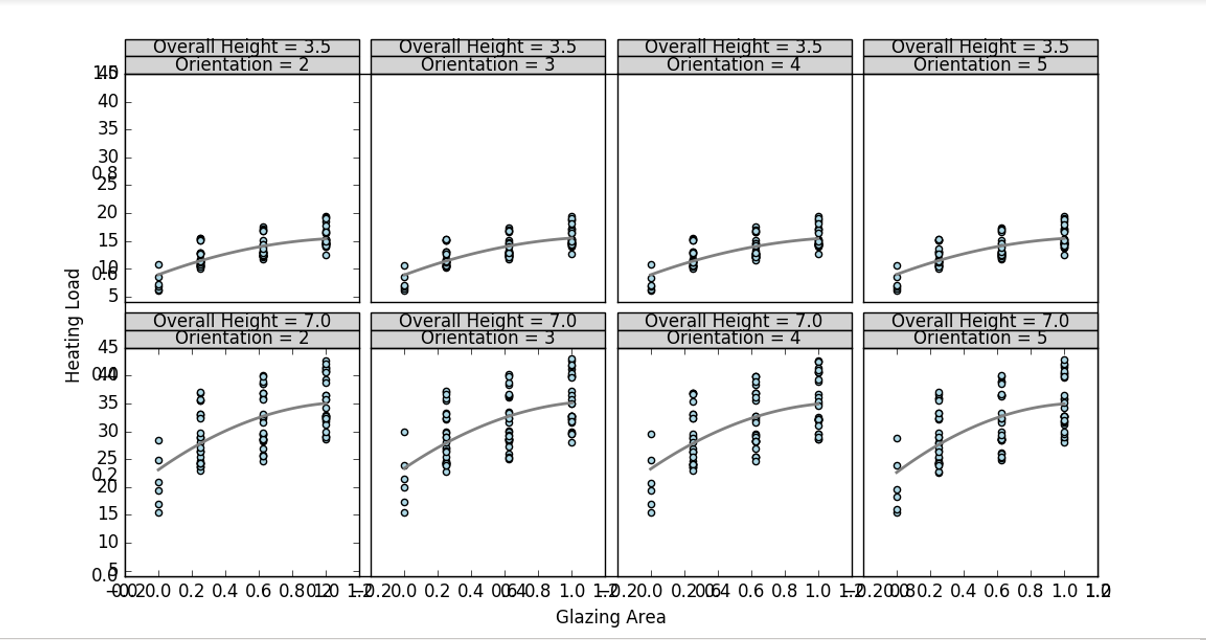
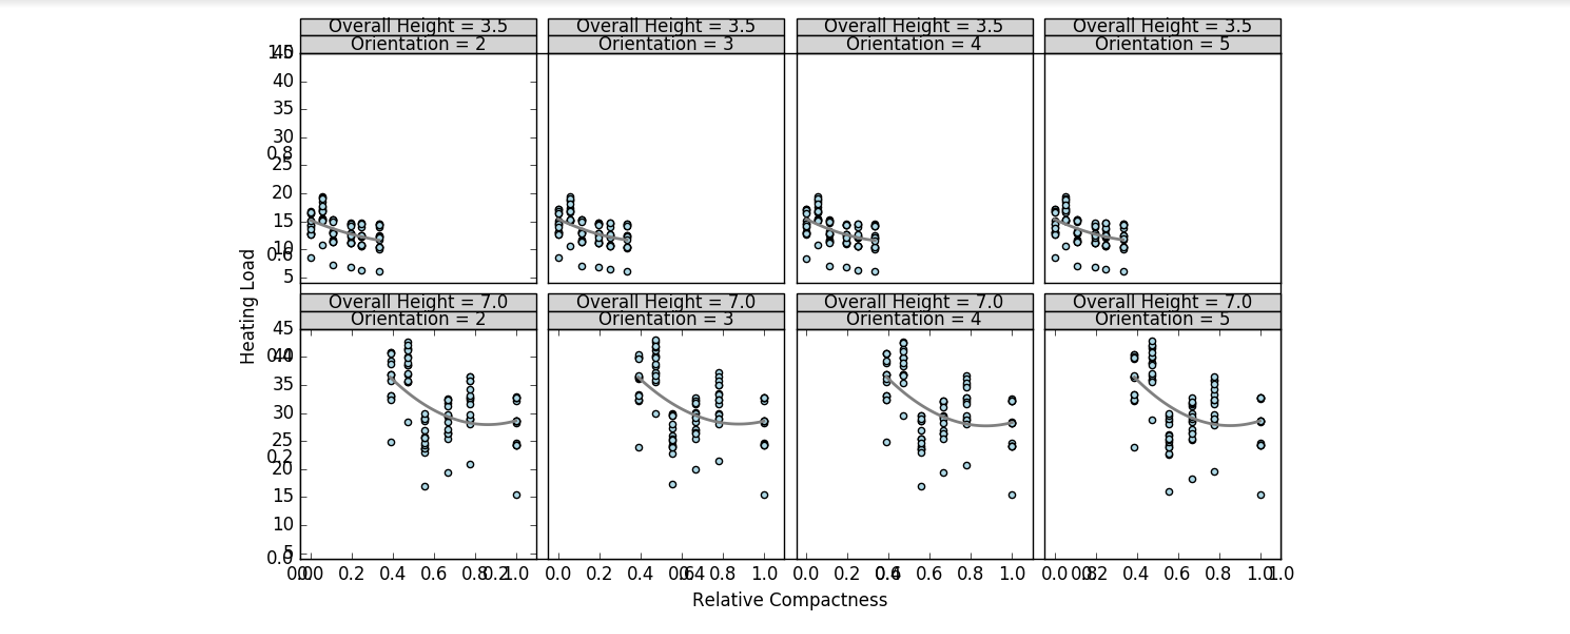
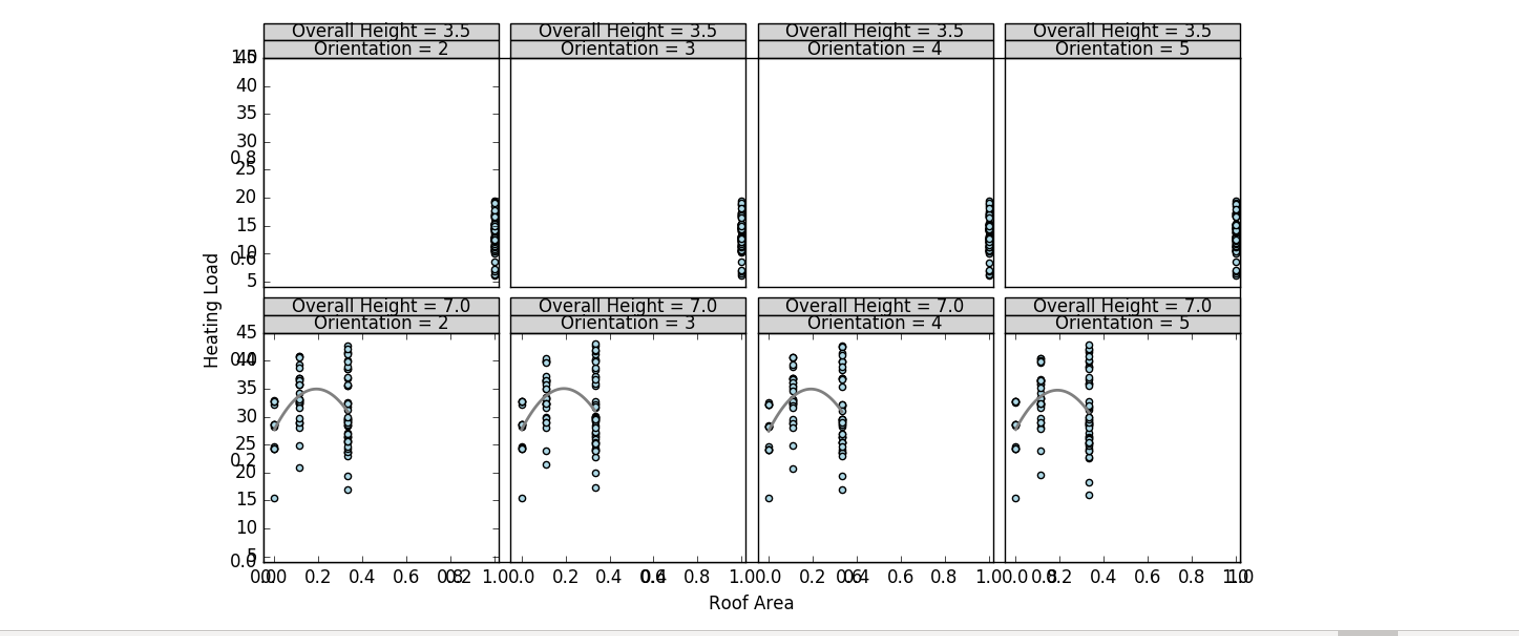
Question 1 : from the graphs on the top Take a screenshot of the scatter plot showing Relative Compactness versus Heating Load. Look closely at the various orientation plots. Explain why orientation is not a significant feature based on the plots.
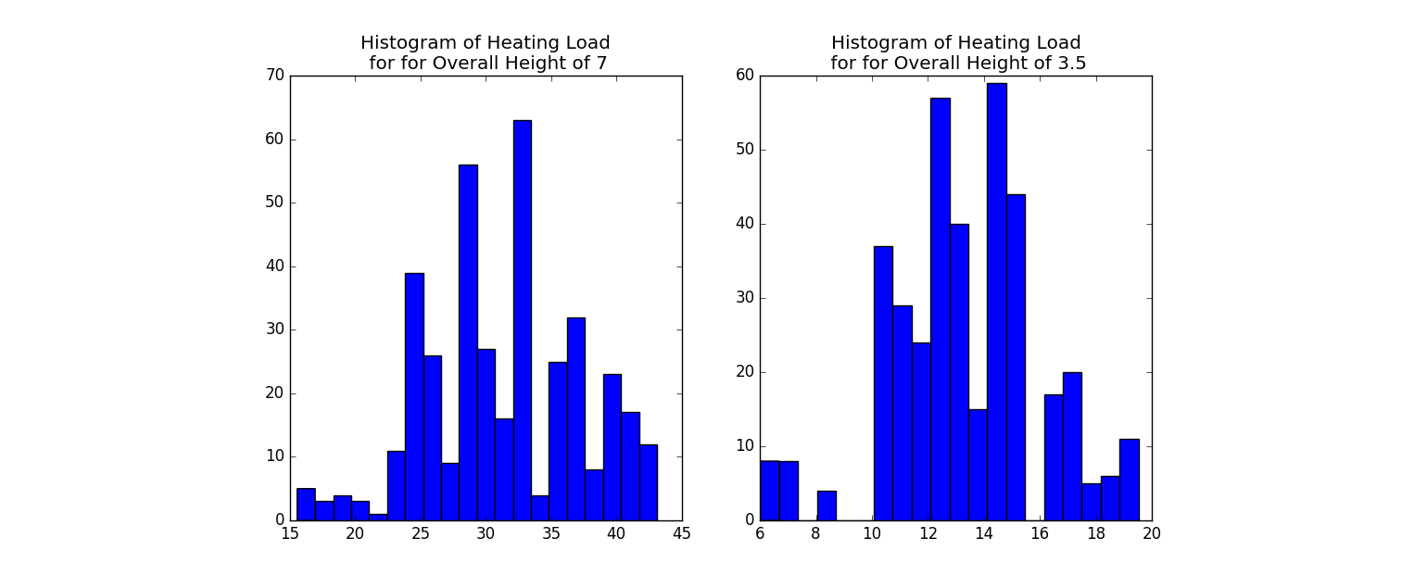
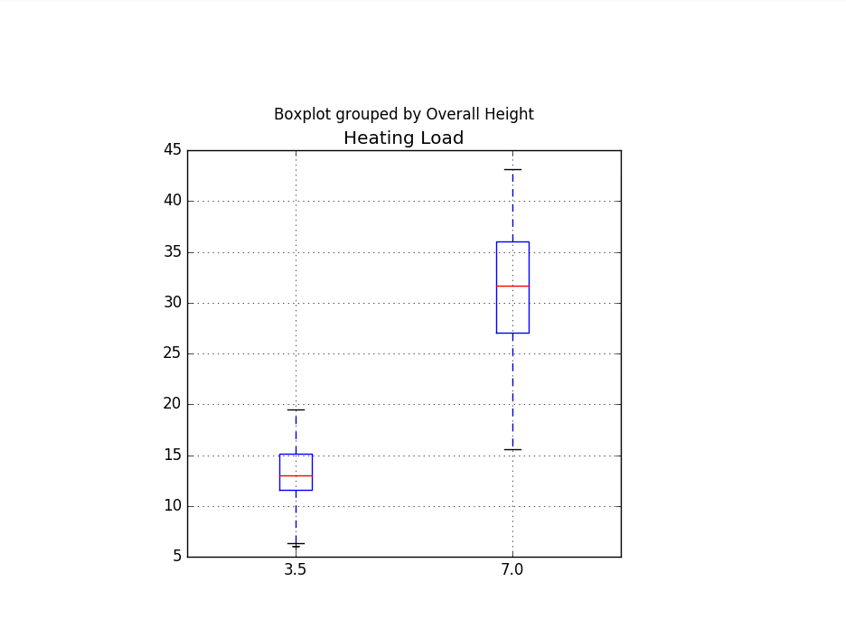
Question 2 : From the graphs on the top Take a screenshot of the boxplot of the heating load. Examine this chart and note how different the distribution of Heating Load is for the two values of Overall Height. Be sure to list the two values of Overall Height we are researching
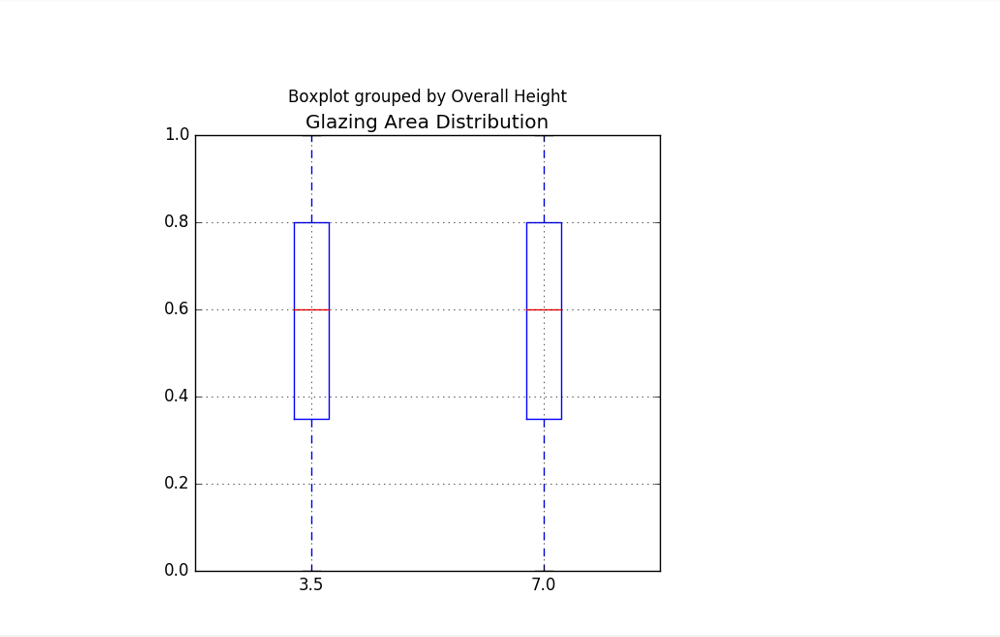
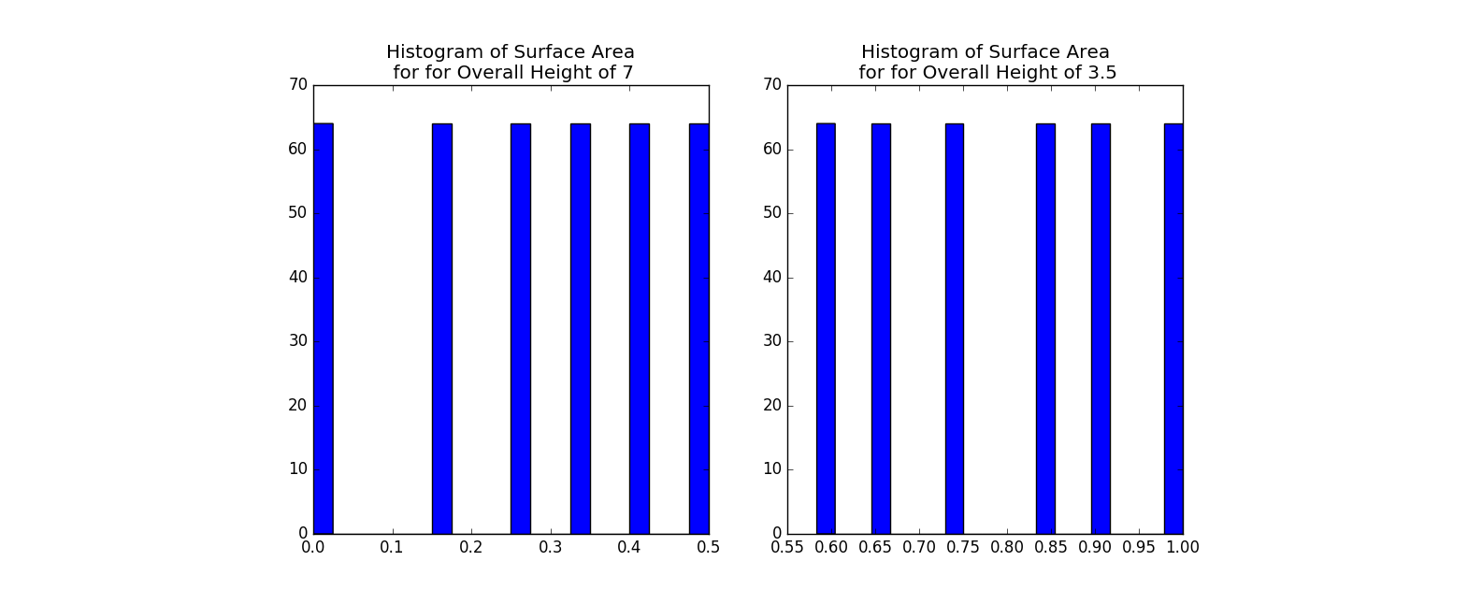
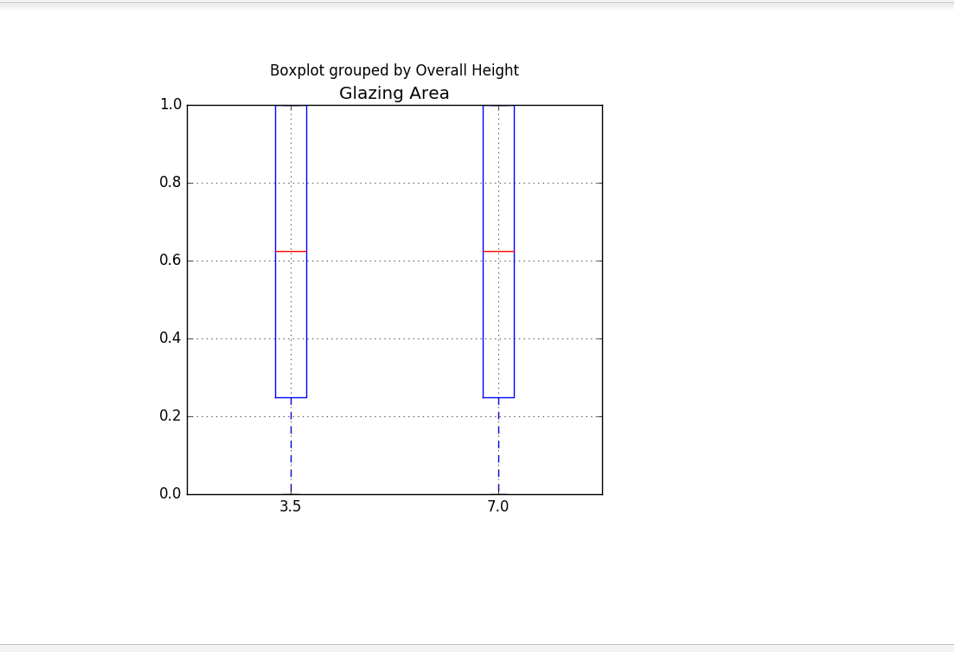
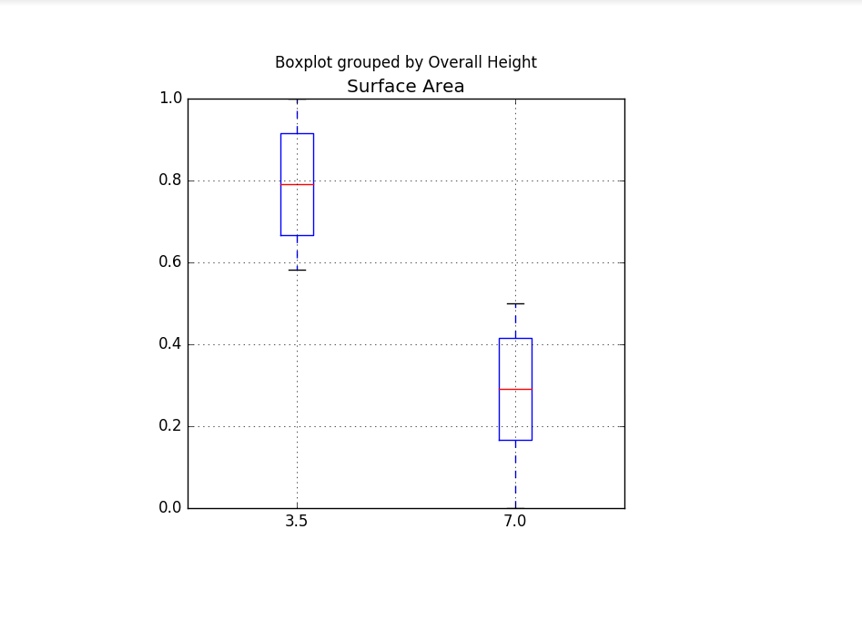
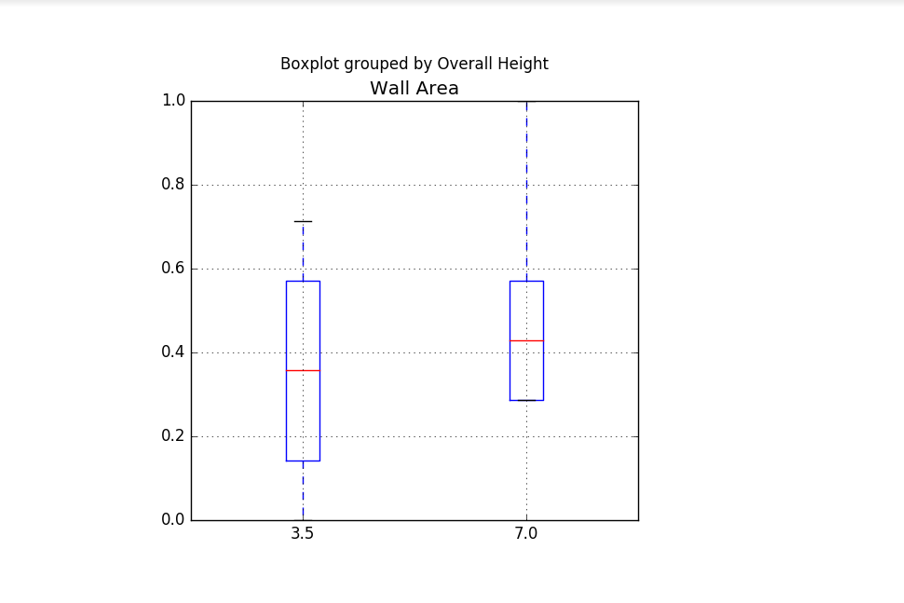
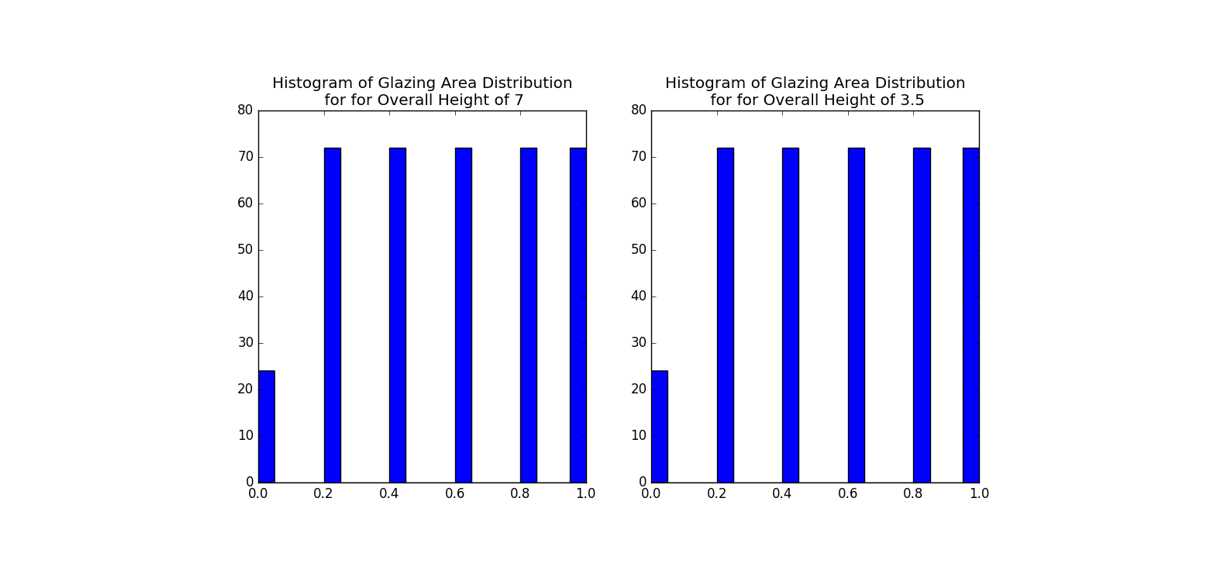
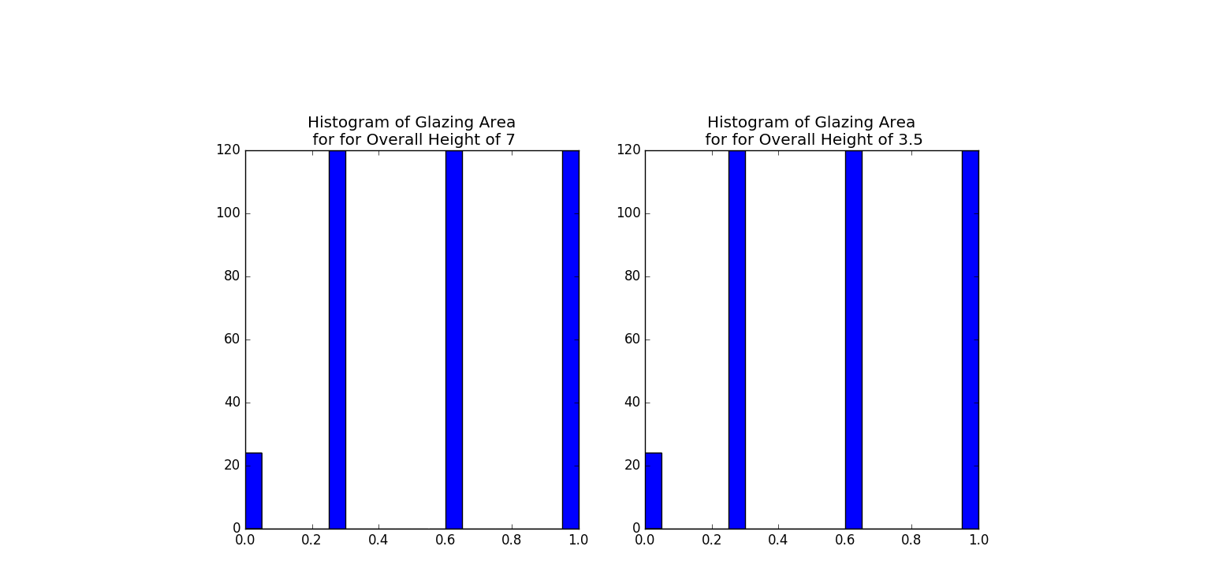
1.0 0.8 0.6 0.4 0.2 0.0 Boxplot grouped by Overall Height Glazing Area Distribution 3.5 7.0
Step by Step Solution
There are 3 Steps involved in it

Get step-by-step solutions from verified subject matter experts