

Question: QUESTION 1 Given below the balance sheet and financial data for Indah Aman Company as at 31 December 2012. ASSETS Cash Marketable securities Accounts receivables
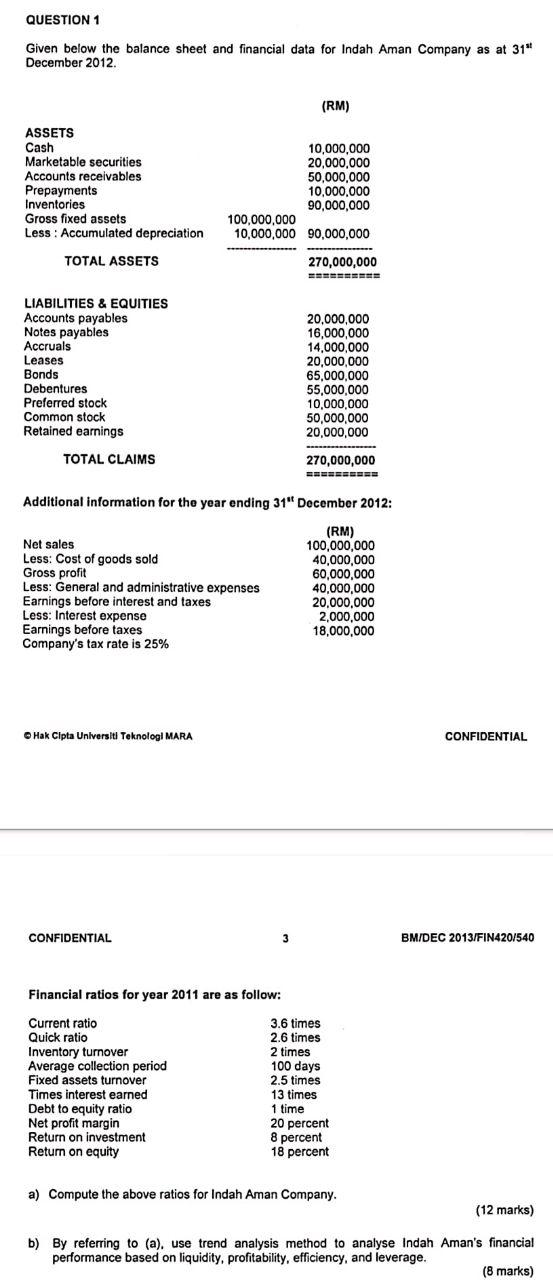
QUESTION 1 Given below the balance sheet and financial data for Indah Aman Company as at 31" December 2012. ASSETS Cash Marketable securities Accounts receivables Prepayments Inventories Gross fixed assets Less: Accumulated depreciation TOTAL ASSETS LIABILITIES & EQUITIES Accounts payables Notes payables Accruals Leases Bonds Debentures Preferred stock Common stock Retained earnings TOTAL CLAIMS Net sales Less: Cost of goods sold Gross profit Less: General and administrative expenses Earnings before interest and taxes Less: Interest expense Earnings before taxes Company's tax rate is 25% Hak Cipta Universiti Teknologi MARA CONFIDENTIAL Financial ratios for year 2011 are as follow: Current ratio Quick ratio Inventory turnover Average collection period Fixed assets turnover Times interest earned Debt to equity ratio Net profit margin Return on investment Return on equity (RM) 100,000,000 10,000,000 90,000,000 Additional information for the year ending 31" December 2012: (RM) 100,000,000 10,000,000 20,000,000 50,000,000 3 10,000,000 90,000,000 270,000,000 ========== 20,000,000 16,000,000 14,000,000 20,000,000 65,000,000 55,000,000 10,000,000 50,000,000 20,000,000 270,000,000 ========== 40,000,000 60,000,000 40,000,000 20,000,000 2,000,000 18,000,000 3.6 times 2.6 times 2 times 100 days 2.5 times 13 times 1 time 20 percent 8 percent 18 percent a) Compute the above ratios for Indah Aman Company. CONFIDENTIAL BM/DEC 2013/FIN420/540 (12 marks) b) By referring to (a), use trend analysis method to analyse Indah Aman's financial performance based on liquidity, profitability, efficiency, and leverage. (8 marks)
Step by Step Solution
There are 3 Steps involved in it

Get step-by-step solutions from verified subject matter experts