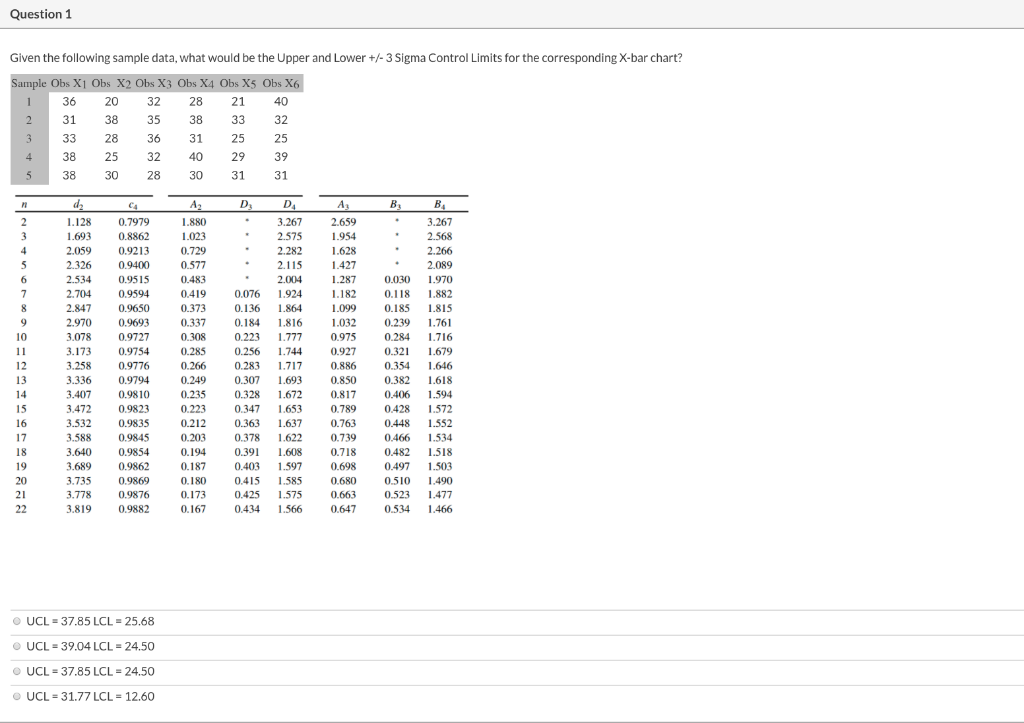
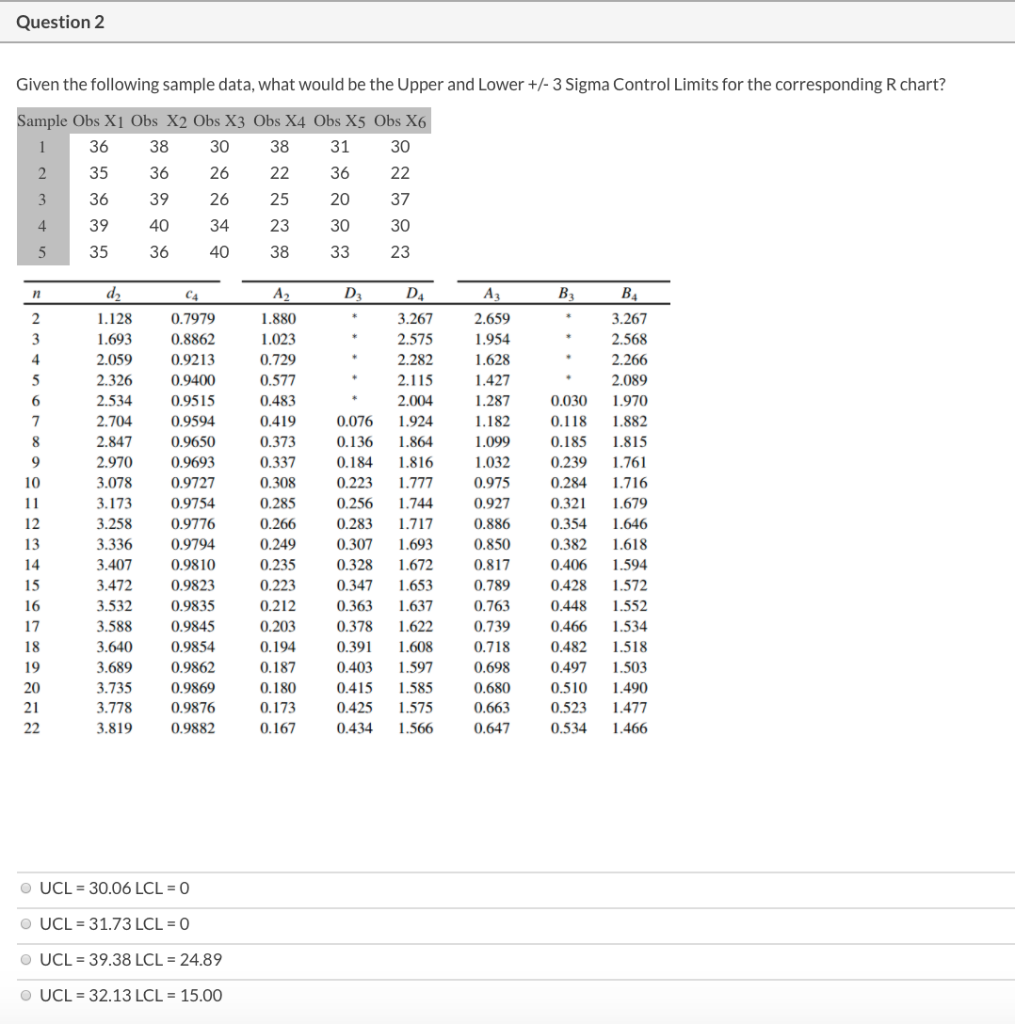
Question: Question 1 Given the following sample data, what would be the Upper and Lower +/- 3 Sigma Control Limits for the corresponding X-bar chart? Sample

Question 1 Given the following sample data, whatQuestion 1 Given the following sample data, what

Question 1 Given the following sample data, what would be the Upper and Lower +/- 3 Sigma Control Limits for the corresponding X-bar chart? Sample Obs X1 Obs X2 Obs X3 Obs X4 Obs X5 Obs X6 1 36 20 32 28 21 40 31 38 35 38 33 32 3 33 28 36 31 25 25 25 32 40 2939 38 30 28 30 nd2C ADDA BB 1.128 0.79791 .880 . 3.267 2.659 . 3.267 1.693 0.8862 1.023 2.575 1.954 . 2.568 2.059 0.9213 0.729 2.282 1.628 . 2.266 2.326 0.9400 0.577 2.115 1.427 2.089 2.534 0.9515 0.483 2.004 1.287 0.030 1.970 2.704 0.9594 0.419 0.076 1.924 1.182 0.118 1.882 2.847 0.9650 0.373 0.136 1.864 1.099 0.185 1.815 2.970 0.9693 0.337 0.184 1.816 1.032 0.239 1.761 3.078 0.9727 0.308 0.223 1.777 0.975 0.284 1.716 3.173 0.9754 0.285 0.256 1.744 0.927 0.321 1.679 3.258 0.9776 0.266 0.283 1.717 0.886 0.354 1.646 3.336 0.9794 0.249 0.307 1.693 0.850 0.382 1.618 3.407 0.9810 0.235 0.328 1.672 0.817 0.406 1.594 3.472 0.9823 0.223 0.347 1.653 0.789 0.428 1.572 3.532 0.9835 0.212 0.363 1.637 0.763 0.448 1.552 3.588 0.9845 0.203 0.378 1.622 0.739 0.466 1.534 3.640 0.9854 0.194 0.3911.608 0.718 0.482 1.518 3.689 0.9862 0.187 0.403 1.597 0.698 0.497 1.503 3.735 0.9869 0.180 0.415 1.585 0.680 0.510 1.490 3.778 0.9876 0.425 1.575 0.663 0.523 1.477 3.819 0.9882 0.167 0.434 1.566 0.647 0.534 1.466 0.173 UCL = 37.85 LCL = 25.68 UCL = 39.04 LCL = 24.50 UCL = 37.85 LCL = 24.50 UCL = 31.77 LCL = 12.60 Question 2 Given the following sample data, what would be the Upper and Lower +/- 3 Sigma Control Limits for the corresponding R chart? Sample Obs X1 Obs X2 Obs X3 Obs X4 Obs X5 Obs X6 1 36 38 30 38 31 30 2 35 36 26 22 36 22 3 36 39 26 25 20 37 4 39 40 34 23 30 30 35 36 40 38 33 23 2.004 d2C ADDA 1.128 0.7979 1.880 3.267 1.693 0.8862 1.023 2.575 2.059 0.9213 0.729 2.282 2.326 0.9400 0.577 2.115 2.534 0.9515 0.483 2.704 0.9594 0.419 0.076 1.924 2.847 0.9650 0.373 0.136 1.864 2.970 0.9693 0.337 0.184 1.816 3.078 0.9727 0.308 0.223 1.777 3.173 0.9754 0.285 0.256 1.744 3.258 0.9776 0.266 0.283 1.717 3.336 0.9794 0.249 0.307 1.693 3.407 0.9810 0.235 0.328 1.672 3.472 0.9823 0.223 0.347 1.653 3.532 0.9835 0.212 0.363 1.637 3.588 0.9845 0.203 0.378 1.622 3.640 0.9854 0.194 0.391 1.608 3.689 0.9862 0.187 0.403 1.597 3.735 0.9869 0.180 0.415 1.585 3.778 0.9876 0.173 0.425 1.575 3.819 0.9882 0.167 0.434 1.566 A 2.659 1.954 1.628 1.427 1.287 1.182 1.099 1.032 0.975 0.927 0.886 0.850 0.817 0.789 0.763 0.739 0.718 0.698 0.680 0.663 0.647 B B 3.267 2.568 2.266 2.089 0.030 1.970 0.1181.882 0.185 1.815 0.239 1.761 0.284 1.716 0.321 1.679 0.354 1.646 0.382 1.618 0.406 1.594 0.428 1.572 0.448 1.552 0.466 1.534 0.482 1.518 0.497 1.503 0.510 1.490 0.523 1.477 0.534 1.466 UCL = 30.06 LCL = 0 UCL = 31.73 LCL = 0 UCL = 39.38 LCL = 24.89 UCL = 32.13 LCL = 15.00

Step by Step Solution

There are 3 Steps involved in it

1 Expert Approved Answer
Step: 1 Unlock blur-text-image
Question Has Been Solved by an Expert!

Get step-by-step solutions from verified subject matter experts

Step: 2 Unlock
Step: 3 Unlock

Students Have Also Explored These Related General Management Questions!