

Question: Question 1 Graph the following data and comment on significant features. Sales of a company in $'000 Quarter 2 19 62 31 32 20 65
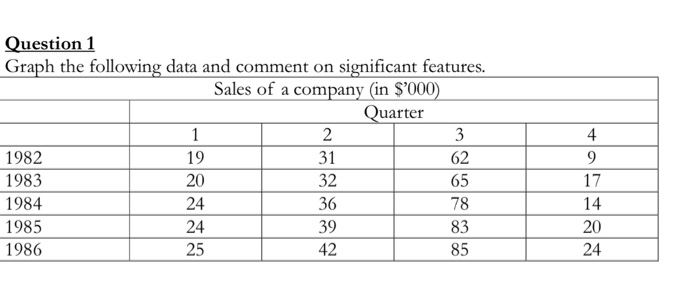
Question 1 Graph the following data and comment on significant features. Sales of a company in $'000 Quarter 2 19 62 31 32 20 65 1982 1983 1984 1985 1986 78 83 85 42
Step by Step Solution
There are 3 Steps involved in it
1 Expert Approved Answer
Step: 1 Unlock

Question Has Been Solved by an Expert!
Get step-by-step solutions from verified subject matter experts
Step: 2 Unlock
Step: 3 Unlock