

Question: question 1 Graph the following inequality. Note: To graph the inequality: 1. Select the type of line below (solid or dashed 2. Plot two points
question 1
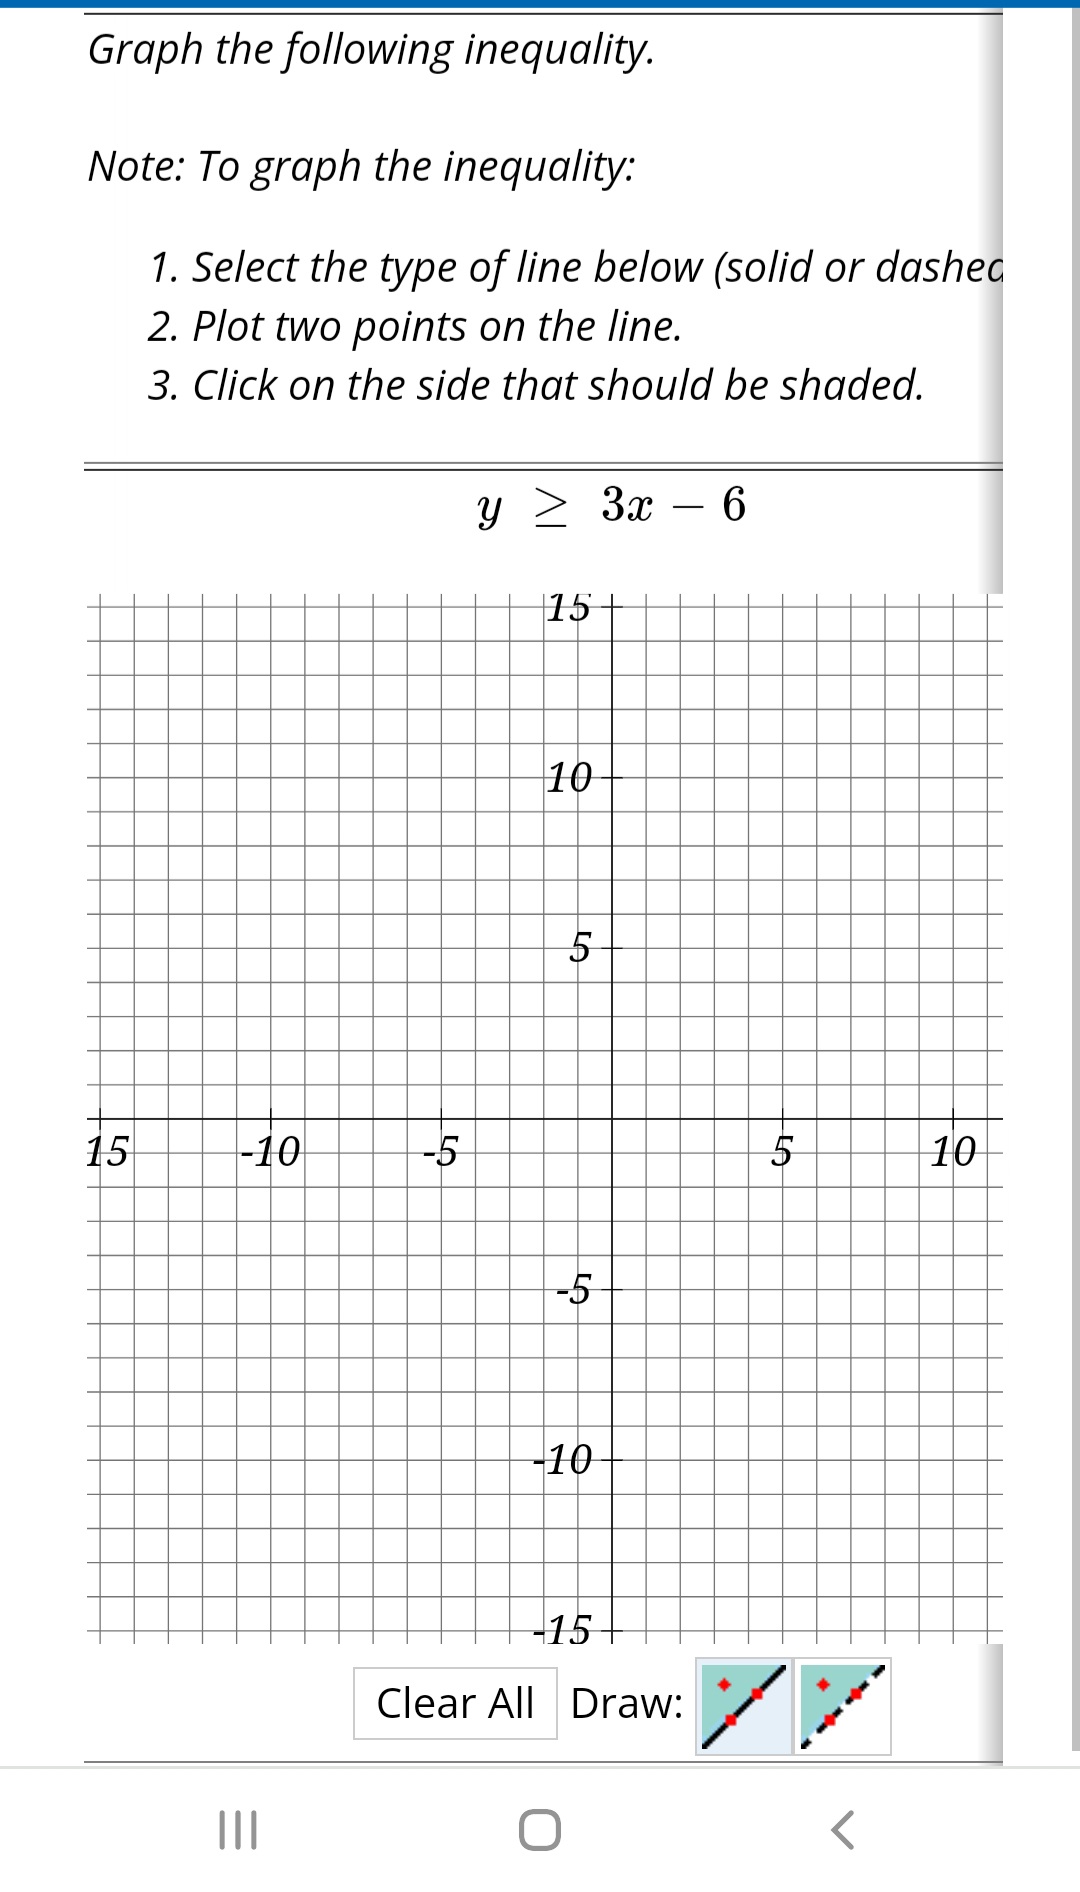
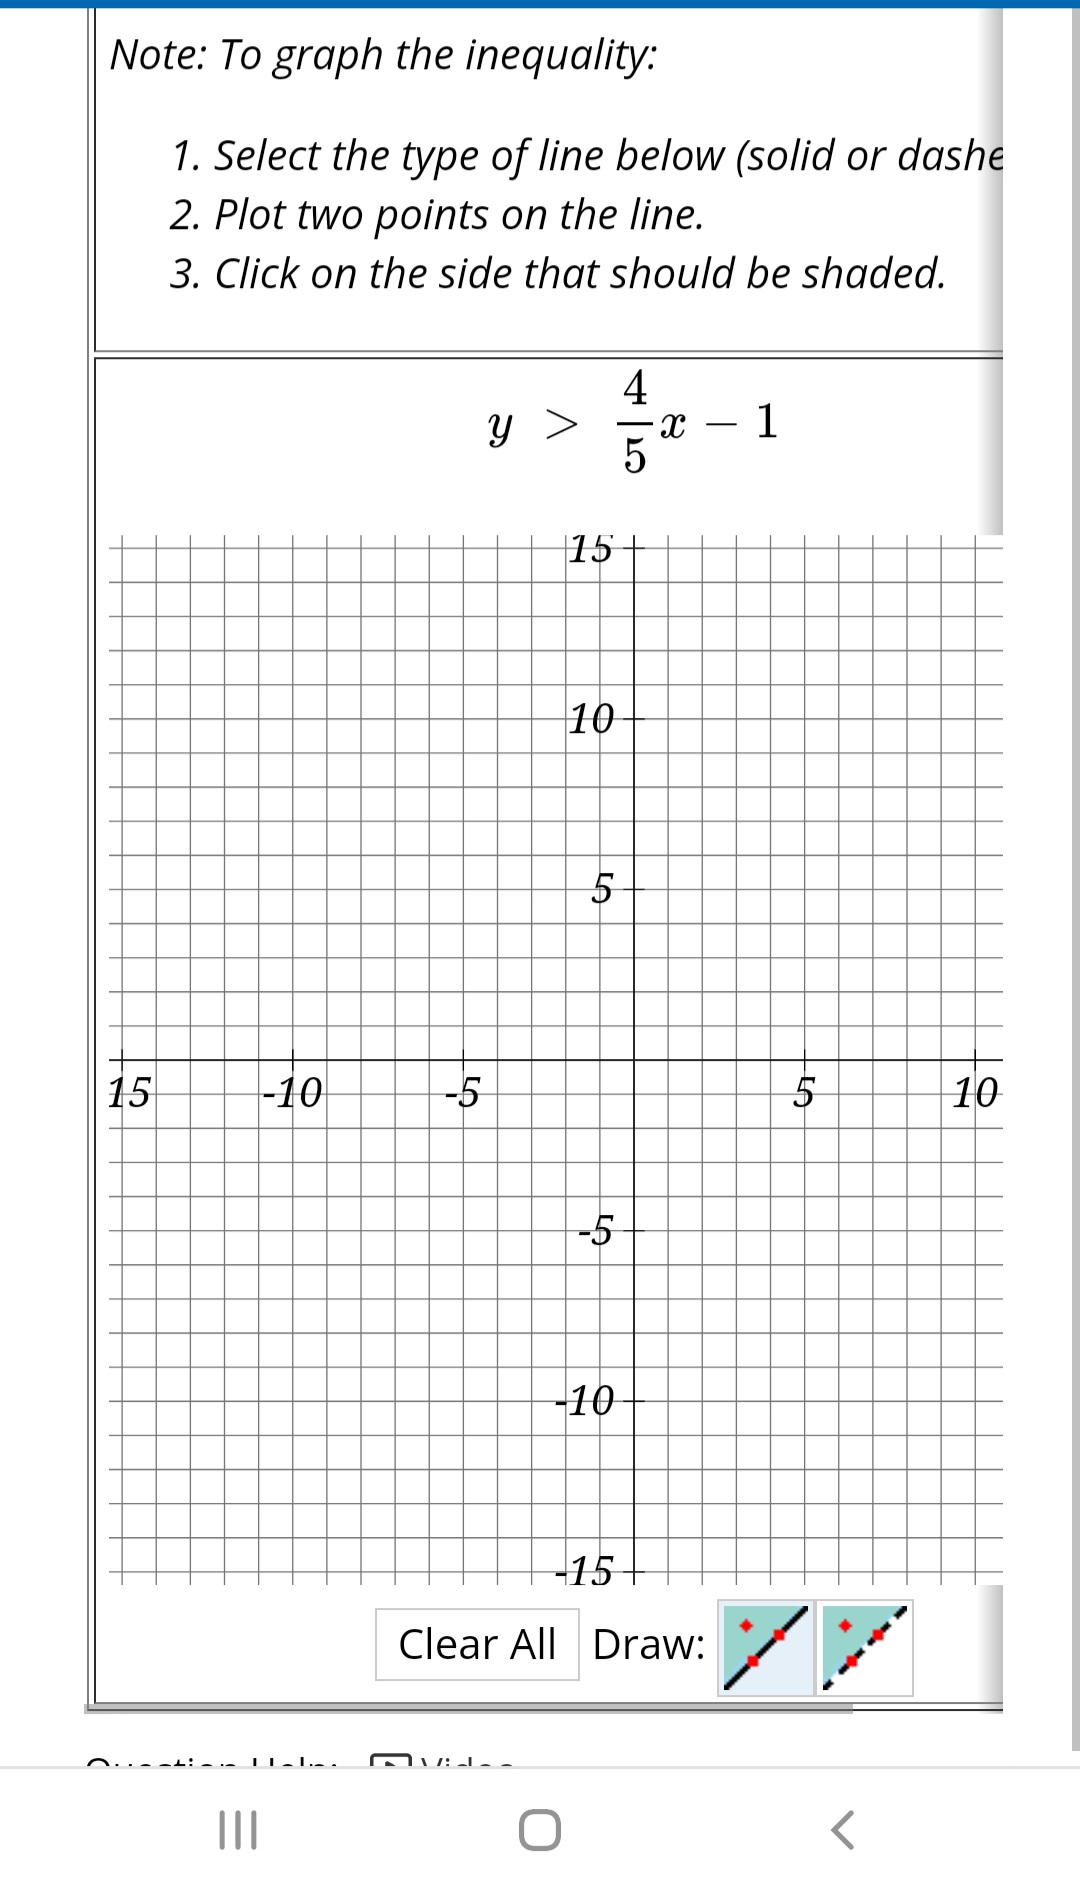
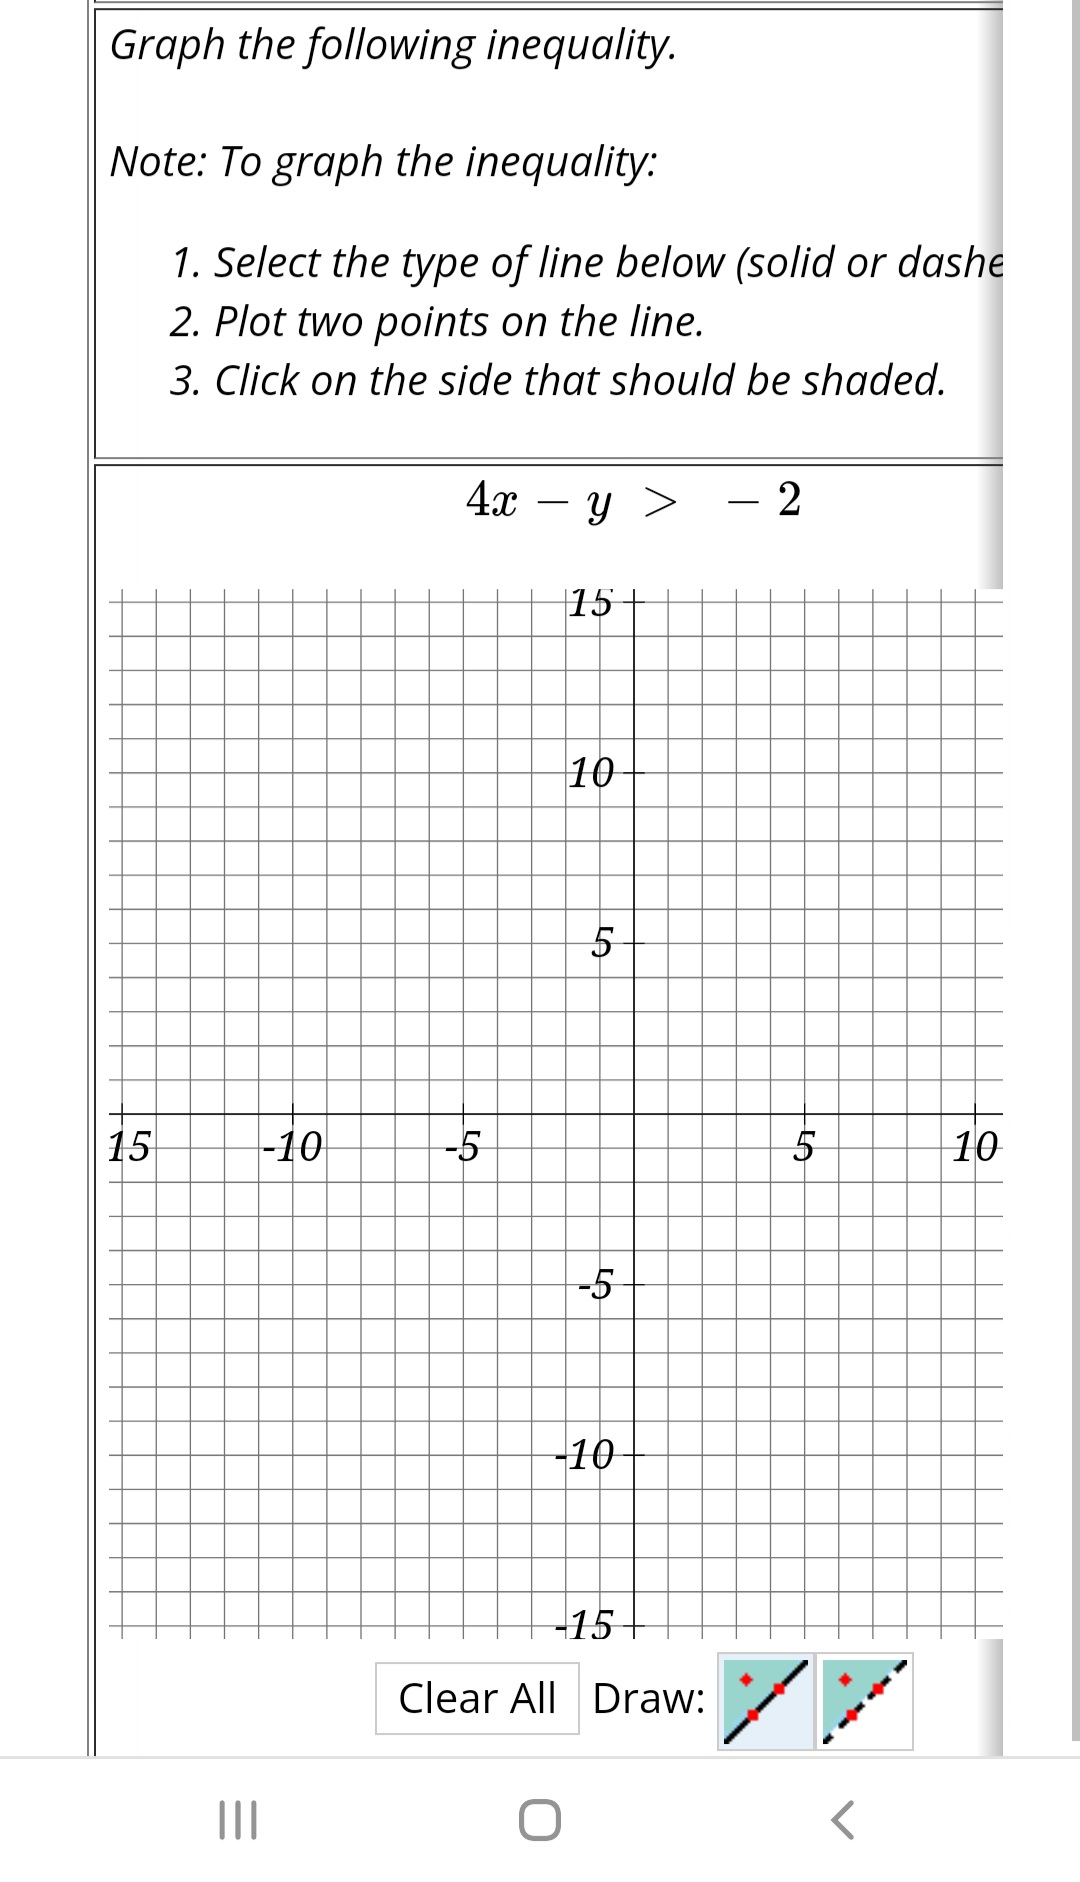
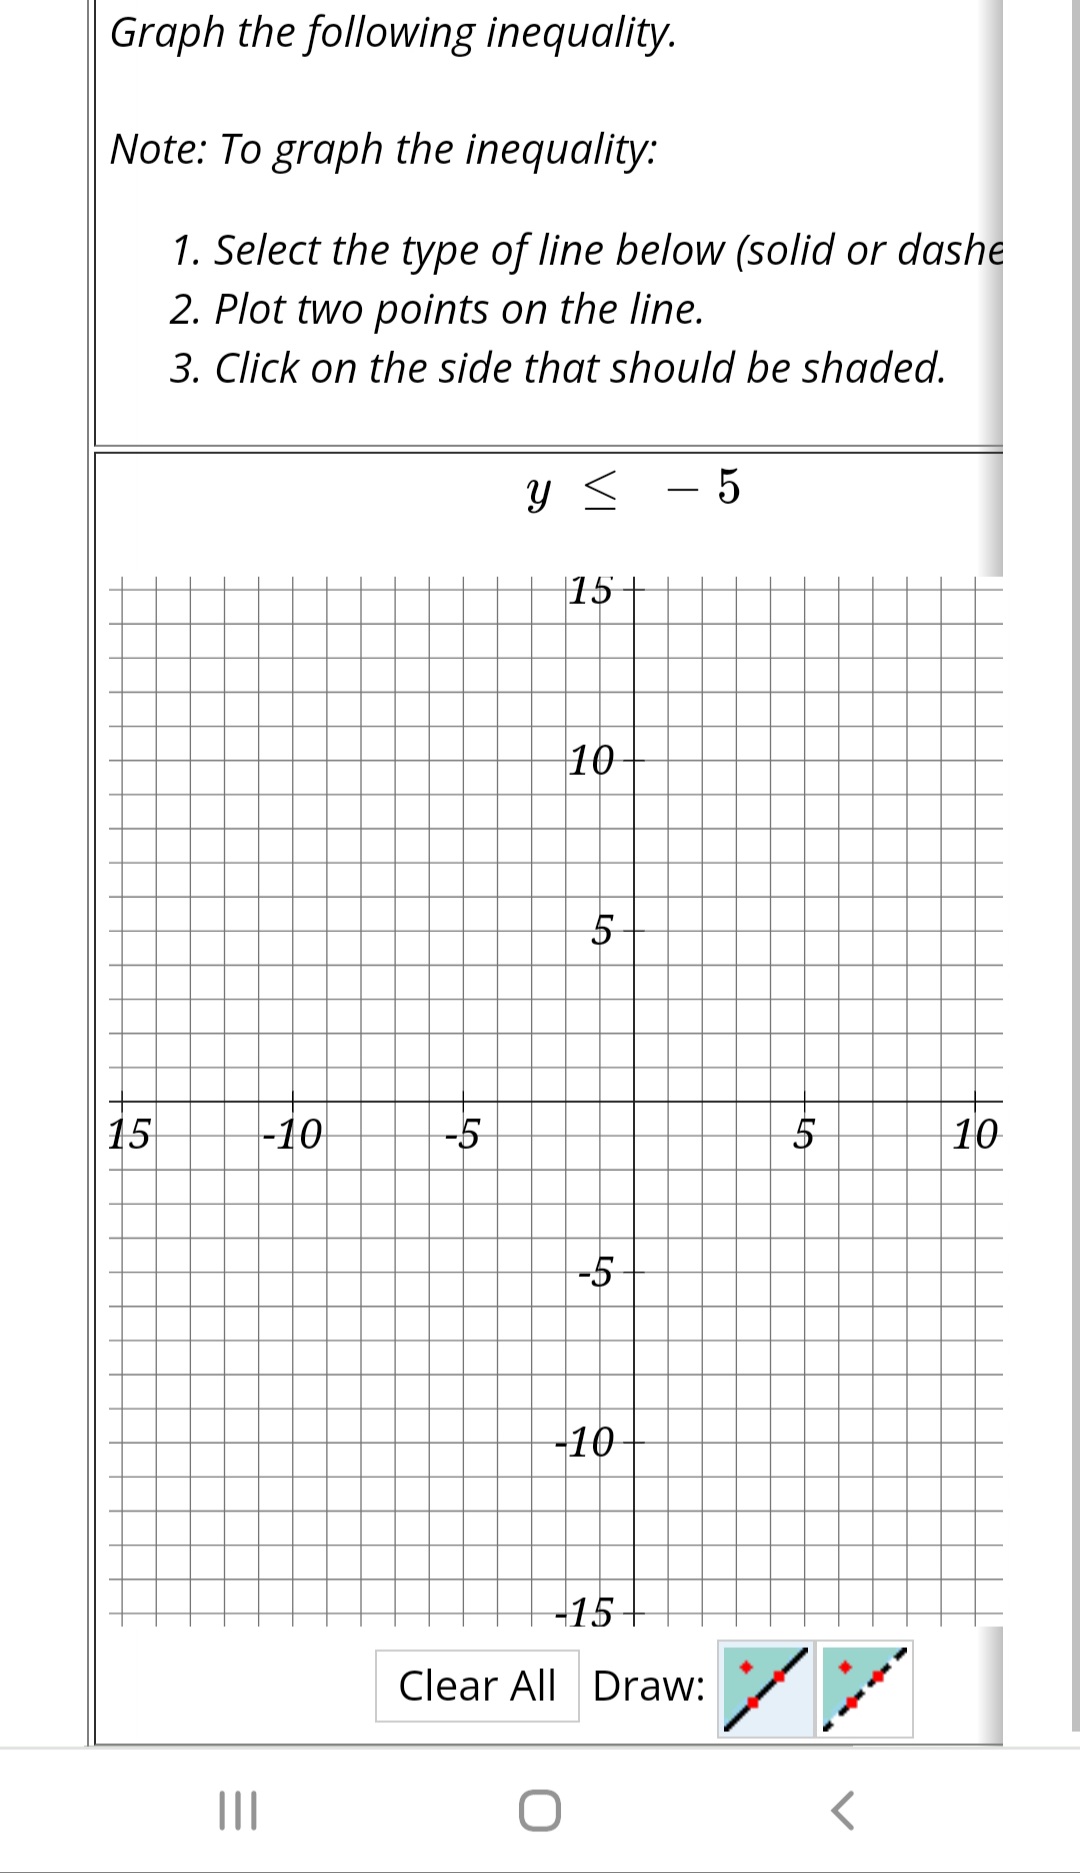
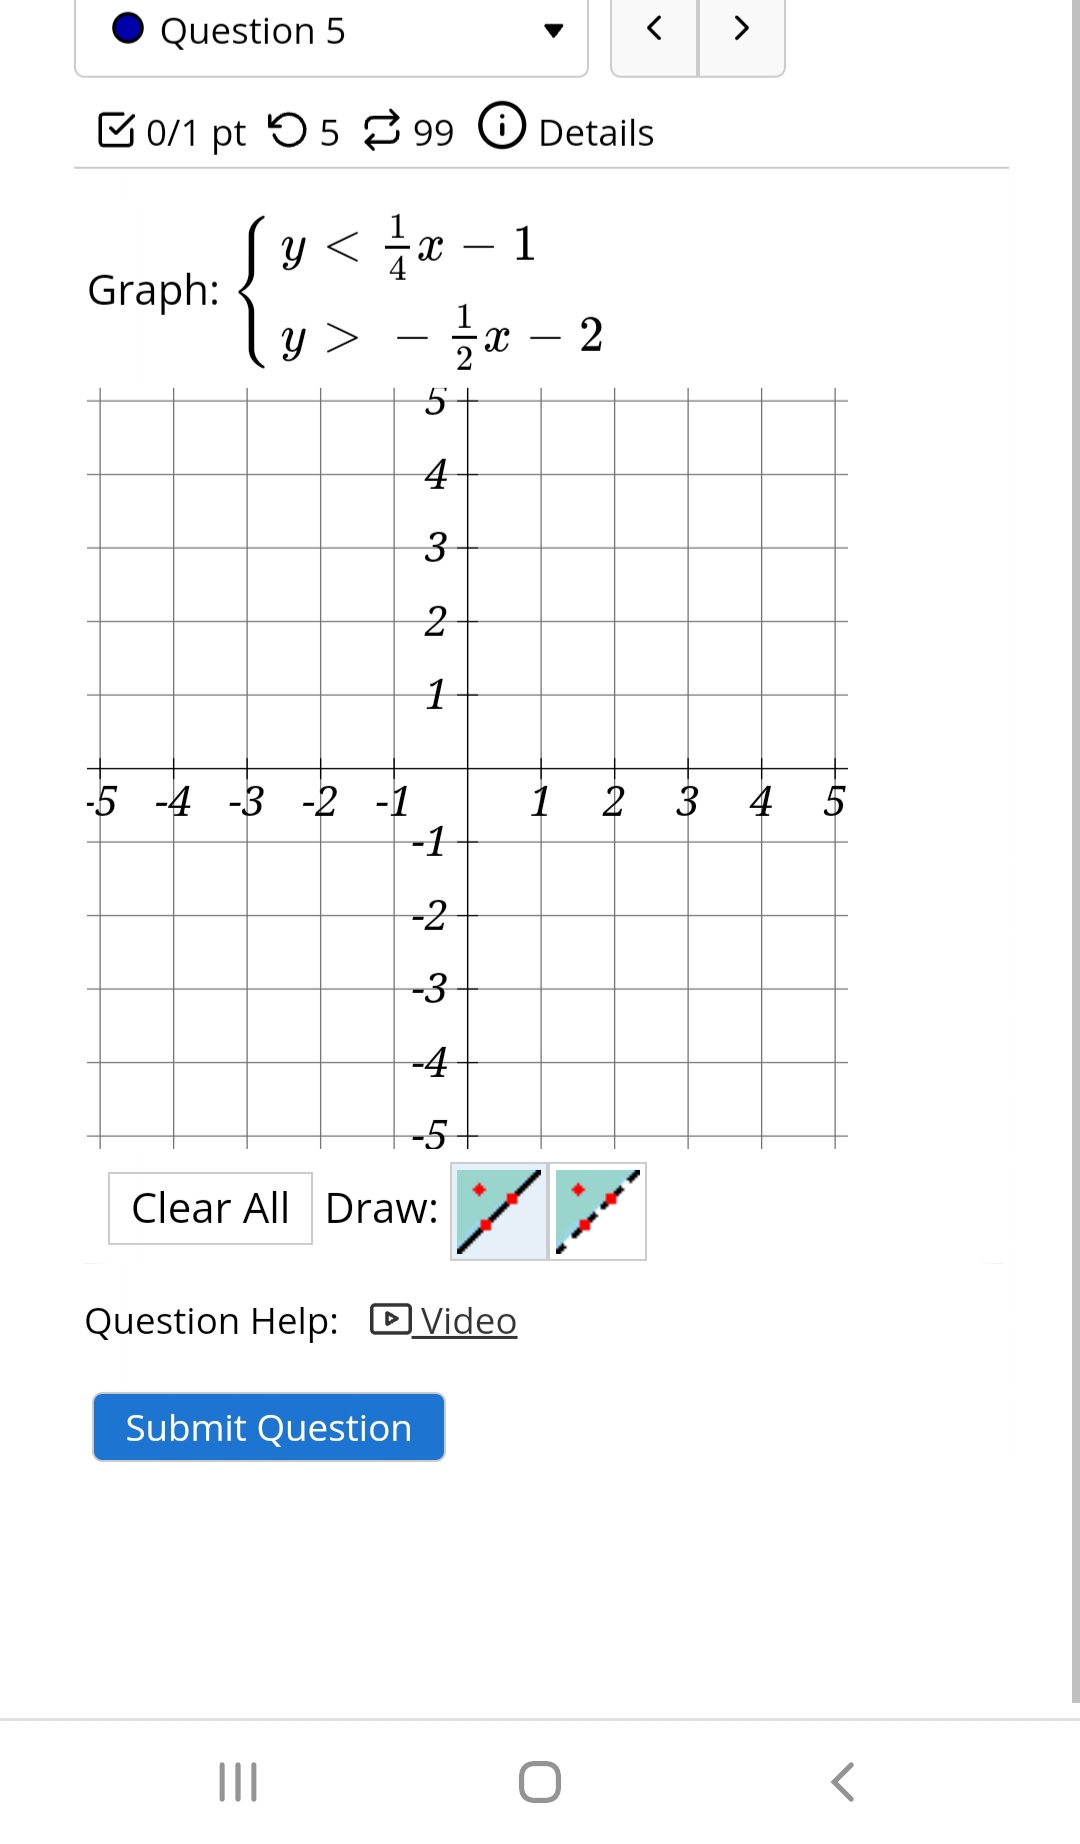
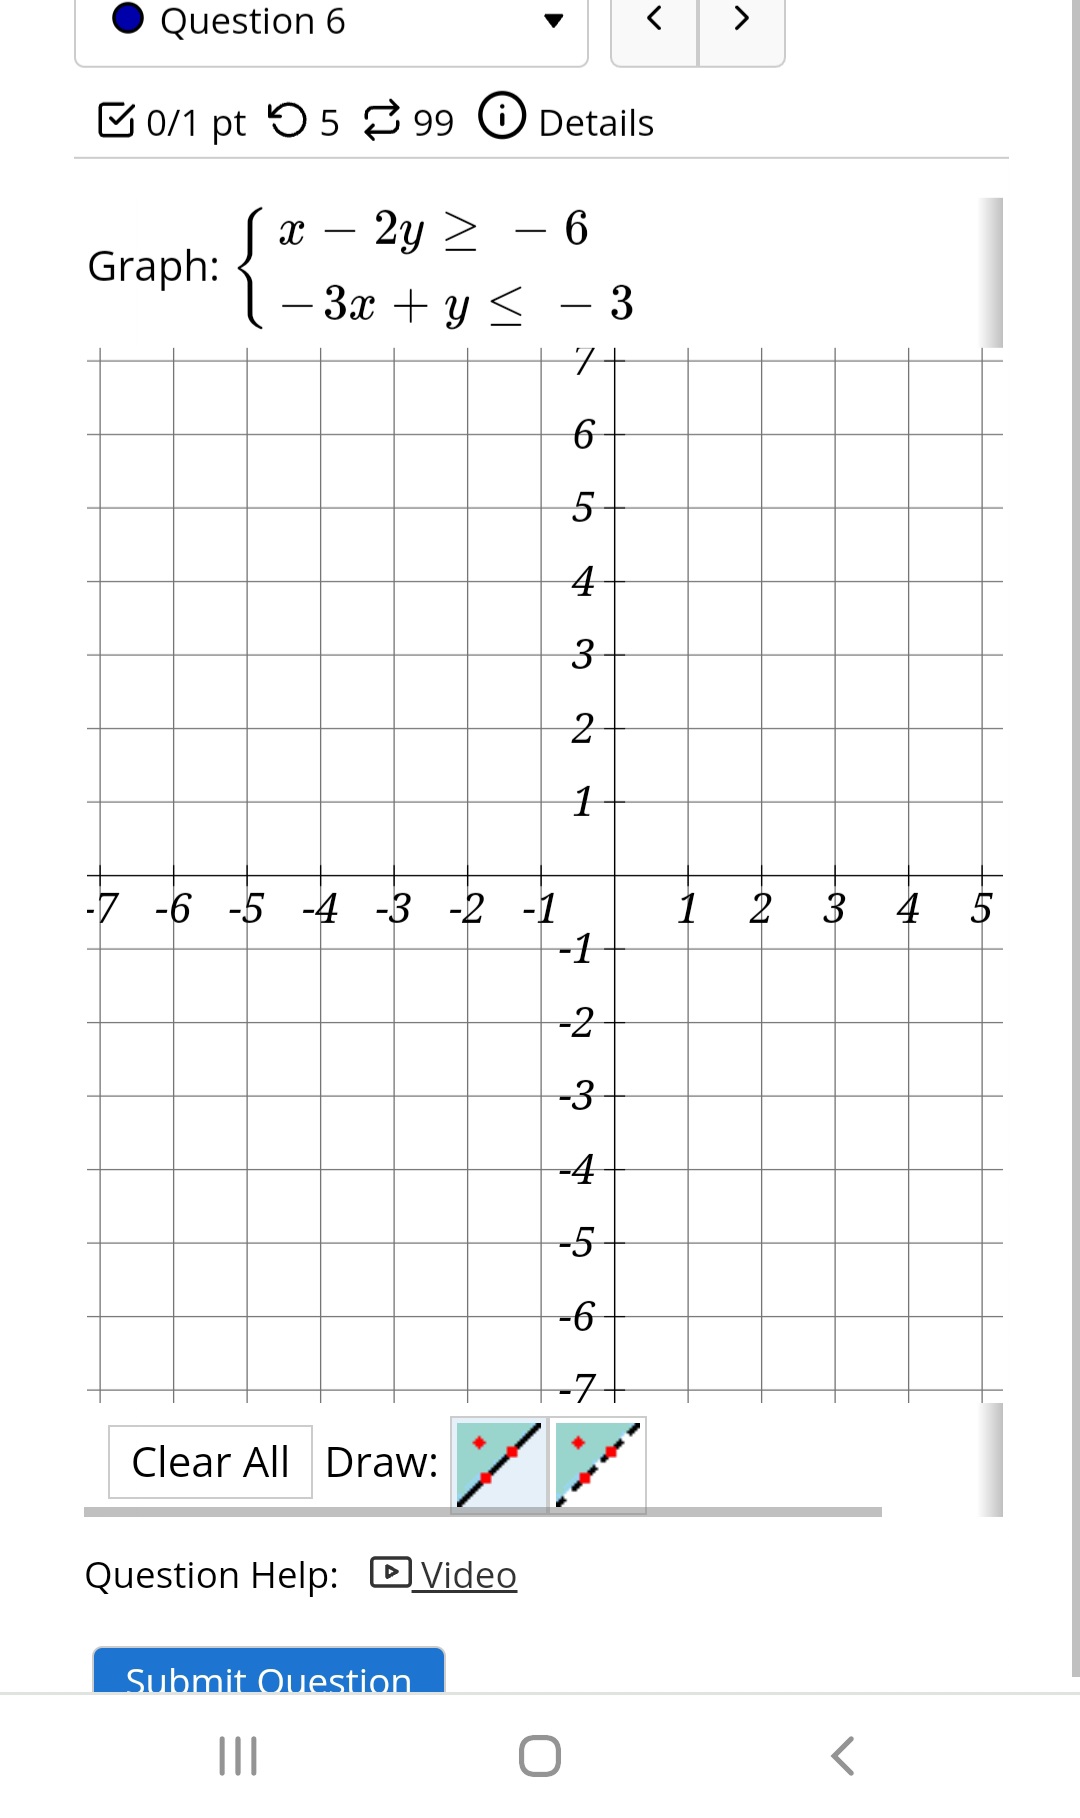
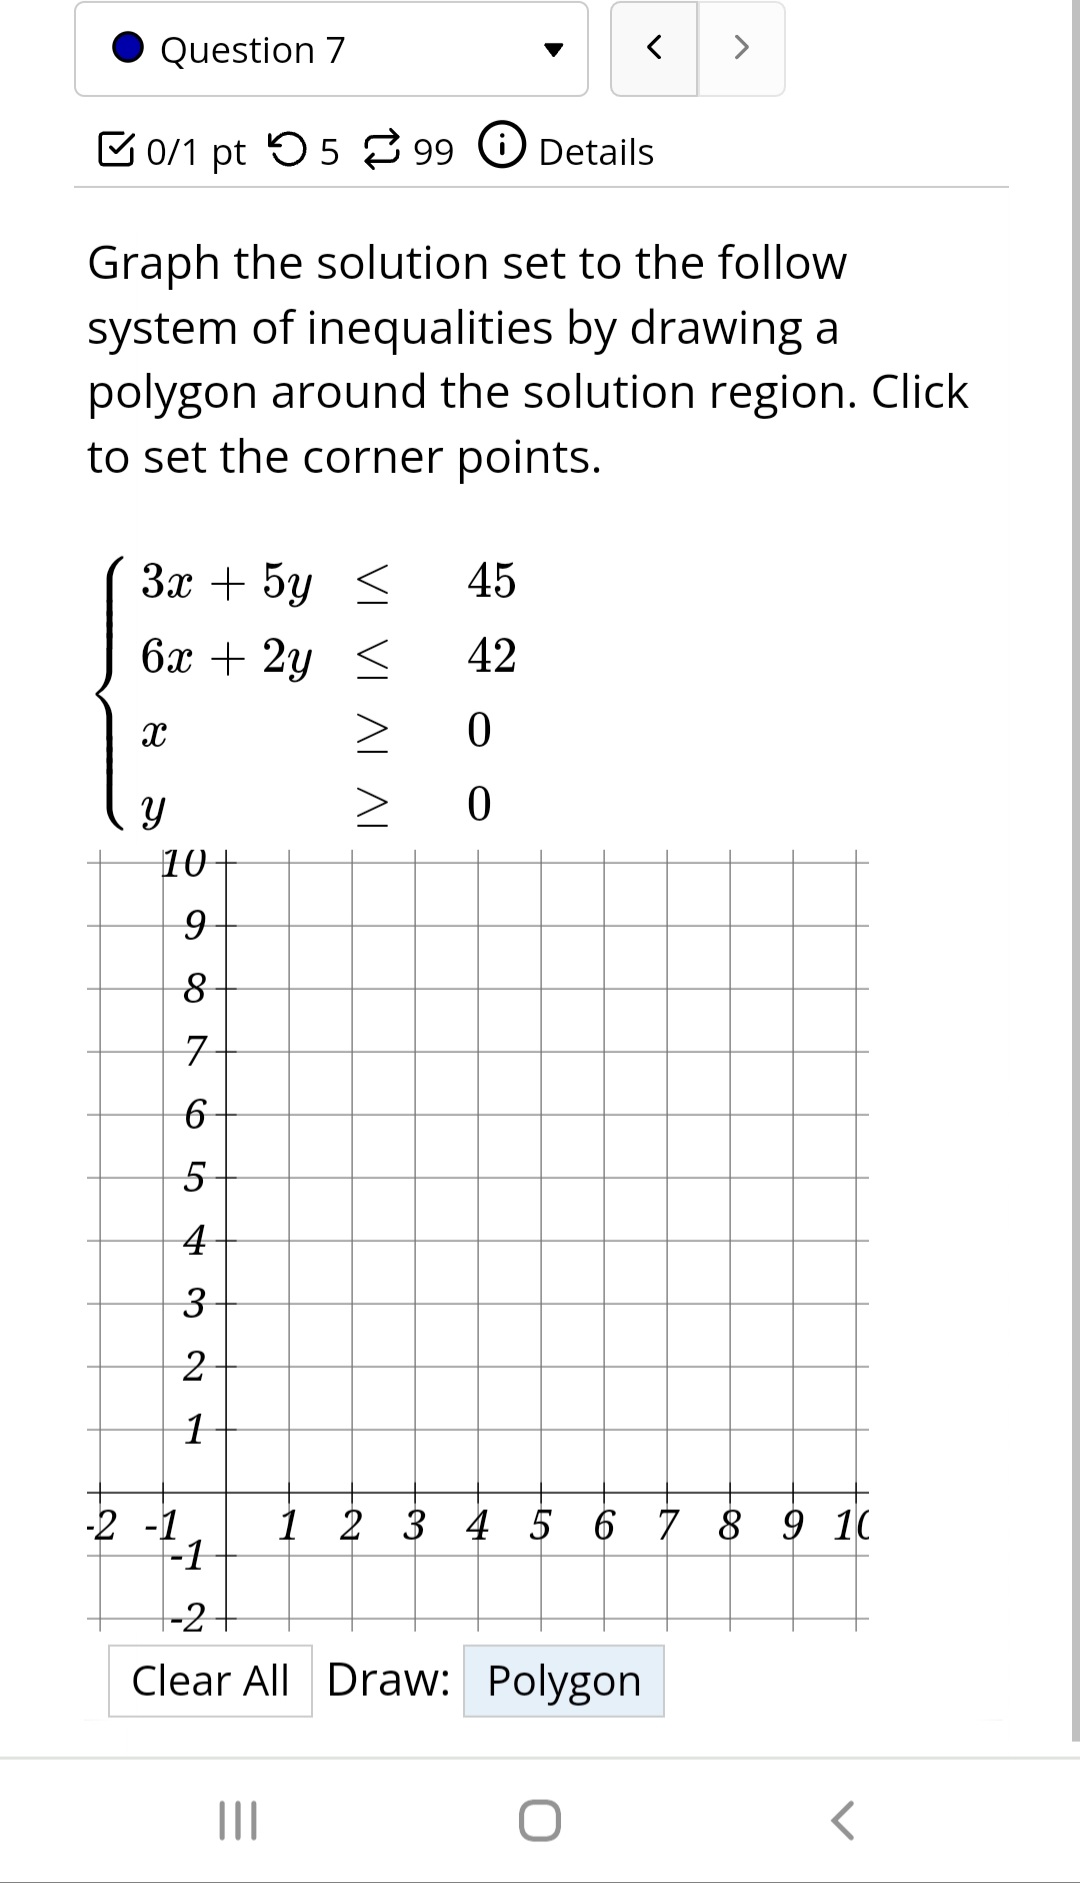
Graph the following inequality. Note: To graph the inequality: 1. Select the type of line below (solid or dashed 2. Plot two points on the line. 3. Click on the side that should be shaded. y z 3x - 6 15+ 10 5 15 -10 -5 10 -5 10 15 Clear All Draw: ONote: To graph the inequality: 1. Select the type of line below (solid or dashe 2. Plot two points on the line. 3. Click on the side that should be shaded. 2 15 -15 7 Clear All Draw: / r 1 O &orpt O5 299 O Details -5 Clear All Draw: / Question Help: Video Submit Question . Question 6 0/1 pt 9 5 99 0 Details x - 2y > - 6 Graph: 3x + y
Step by Step Solution
There are 3 Steps involved in it
1 Expert Approved Answer
Step: 1 Unlock

Question Has Been Solved by an Expert!
Get step-by-step solutions from verified subject matter experts
Step: 2 Unlock
Step: 3 Unlock