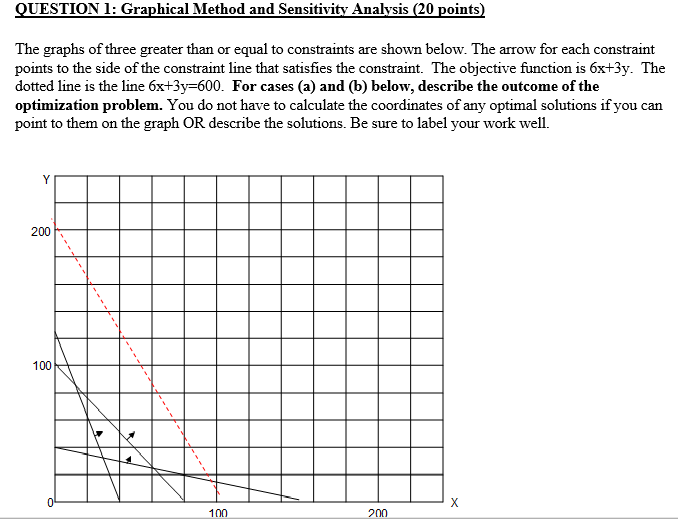
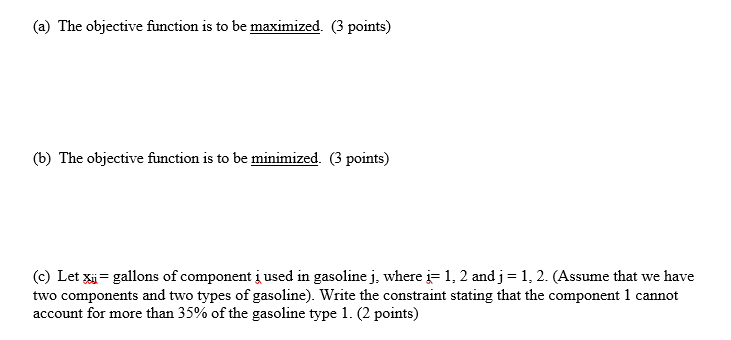
Question: QUESTION 1: Graphical Method and Sensitivity Analysis (20 points) The graphs of three greater than or equal to constraints are shown below. The arrow for

QUESTION 1: Graphical Method and SensitivityQUESTION 1: Graphical Method and Sensitivity

QUESTION 1: Graphical Method and Sensitivity Analysis (20 points) The graphs of three greater than or equal to constraints are shown below. The arrow for each constraint points to the side of the constraint line that satisfies the constraint. The objective function is 6x+3y. The dotted line is the line 6x+3y=600. For cases (a) and (b) below, describe the outcome of the optimization problem. You do not have to calculate the coordinates of any optimal solutions if you can point to them on the graph OR describe the solutions. Be sure to label your work well. Y 200 100 X 100 200 (a) The objective function is to be maximized. (3 points) (b) The objective function is to be minimized. 3 points) (c) Let Xu = gallons of component i used in gasoline j, where i= 1, 2 and j = 1,2. (Assume that we have two components and two types of gasoline). Write the constraint stating that the component 1 cannot account for more than 35% of the gasoline type 1. (2 points)

Step by Step Solution

There are 3 Steps involved in it

1 Expert Approved Answer
Step: 1 Unlock blur-text-image
Question Has Been Solved by an Expert!

Get step-by-step solutions from verified subject matter experts

Step: 2 Unlock
Step: 3 Unlock

Students Have Also Explored These Related General Management Questions!