

Question: Question 1 Here are comparative statement data for Blossom Company and Sunland Company, two competitors. All balance sheet data are as of December 31, 2017,
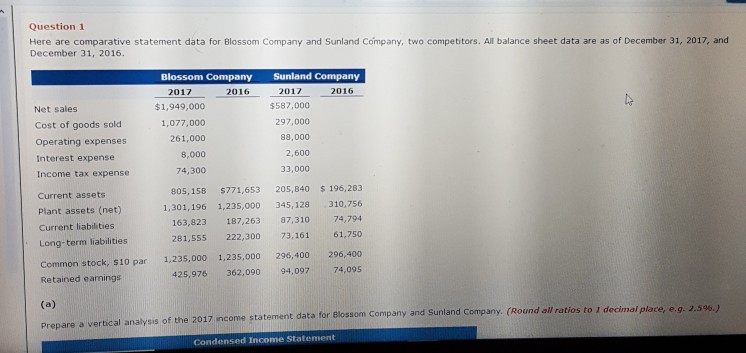
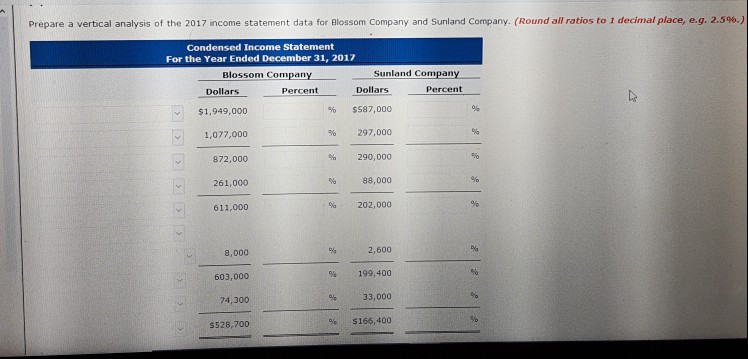
Question 1 Here are comparative statement data for Blossom Company and Sunland Company, two competitors. All balance sheet data are as of December 31, 2017, and December 31, 2016 Blossom Company Sunland Company 2017 2016 2017 2016 $1,949,000 1,077,000 261,000 $587,000 297,000 88,000 2,600 33,000 Net sales Cost of goods sold Operating expenses Interest expense Income tax expense Current assets Plant assets (net) Current liabilaties Long-term liabilities Common stock, $10 par Retained earmings 8,000 74,300 805,158 $771,653 205,840 $ 196,283 1,301, 196 1,235,000 345,128 310,756 163,823 187,263 87,310 74,794 281,555 222,300 73,161 61,750 296,400 425,976 362,090 94,097 74,095 1,235,000 296,400 1,235,000 to 1 decimal place, e.g. 2.596.) Prepare a vertical analysis of the 2017 income statement data for Blossom Company and Sunland Company, (Round all ratios to Condensed Income Statement
Step by Step Solution
There are 3 Steps involved in it

Get step-by-step solutions from verified subject matter experts