

Question: Question: 1. Identifying Good System Administrators. A management consultant is studying the roles played by experience and training in a system administrator's ability to produce
Question:
1. Identifying Good System Administrators. A management consultant is studying the roles played by experience and training in a system administrator's ability to produce these tasks in a specific amount of time. In particular, she is interested in discriminating between administrators who are able to complete given tasks within a specific time and those who are not. Data are collected on the performance of 75 randomly selected administrators.
Data is provided in the following link: https://docs.google.com/spreadsheets/d/11vAIqrujUylddUVuGpuOBFNG3RNQl0ordfSd_XaFj2o/edit?usp=sharing
The variable Experience measures months of full-time system administrator experience, while Training measures the number of relevant training credits. The dependent variable Completed is either Yes or No, according to whether or not the administrator completed the tasks.
a. Make a scatter plot of Experience versus Training using color or symbol to differentiate programmers who complete the task from those who did not complete it. Which predictor(s) appear(s) potentially used for classifying task completion?
b. Run a logistic regression model with both predictors using the entire dataset as training data. Among those who complete the task, what is the percentage of programmers who are incorrectly classified as failing to complete the task?
c. To decrease the percentage in part (c), should the cutoff probability be increased or decreased?
d. How much experience must be accumulated by a programmer with 4 years of training before his or her estimated probability of completing the task exceeds 50%?
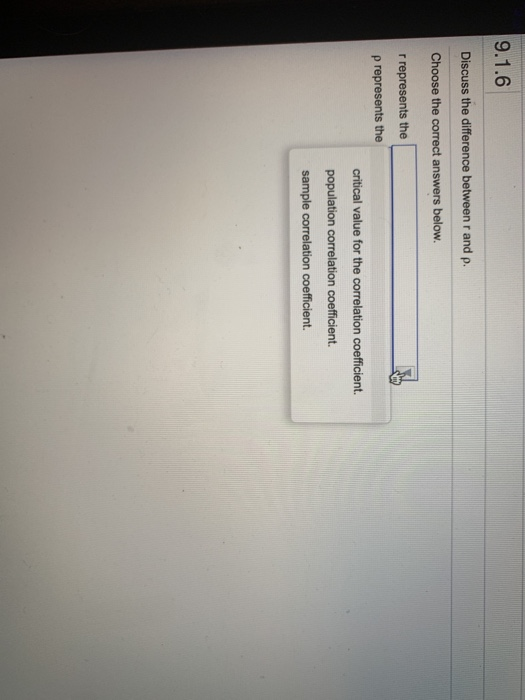
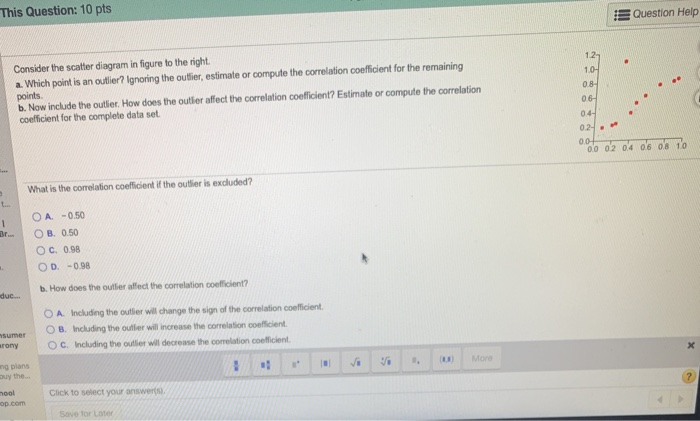
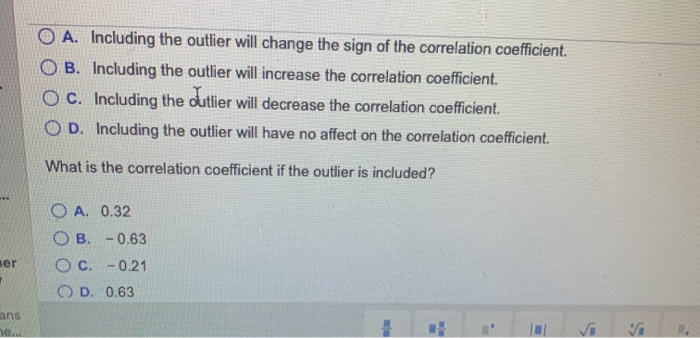
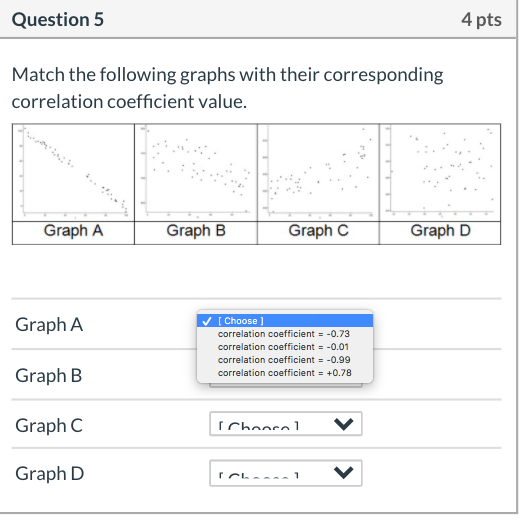
9.1.6 Discuss the difference between r and p. Choose the correct answers below. r represents the p represents the critical value for the correlation coefficient. population correlation coefficient. sample correlation coefficient.This Question: 10 pts Question Help Consider the scatter diagram in figure to the right. a. Which point is an outlier? Ignoring the outlier, estimate or compute the correlation coefficient for the remaining 127 points. b. Now include the outlier. How does the outher affect the correlation coefficient? Estimate or compute the correlation coefficient for the complete data set. 06- 04- 02- 0,0- DO 02 04 06 08 10 What is the comelation coefficient if the outlier is excluded? O A -0.50 O B. 0.50 O C. 0.98 O D. - 0.98 duC.. b. How does the outlier affect the correlation coefficient? O A Including the outlier wil change the sign of the correlation coefficient. sumer O B. Including the outber will increase the correlation confficient. inory O C. Including the outlier will decrease the correlation coefficient. 10 plans More 10-0 Glick to select your answers op.com Save for LaterO A. Including the outlier will change the sign of the correlation coefficient. OB. Including the outlier will increase the correlation coefficient. O C. Including the outlier will decrease the correlation coefficient. O D. Including the outlier will have no affect on the correlation coefficient. What is the correlation coefficient if the outlier is included? O A. 0.32 O B. - 0.63 er O C. - 0.21 O D. 0.63 ans Vi ViQuestion 5 4 pts Match the following graphs with their corresponding correlation coefficient value. Graph A Graph B Graph C Graph D Graph A [ Choose correlation coefficient = -0.73 correlation coefficient = -0.01 correlation coefficient = -0.99 Graph B correlation coefficient = +0.78 Graph C I HAAPA 1 V Graph D V
Step by Step Solution
There are 3 Steps involved in it

Get step-by-step solutions from verified subject matter experts