

Question: QUESTION 1 In the confusion matrix (from a segmentation output) given below: a) Where do the numbers for the Predicted columns come from? (HINT:
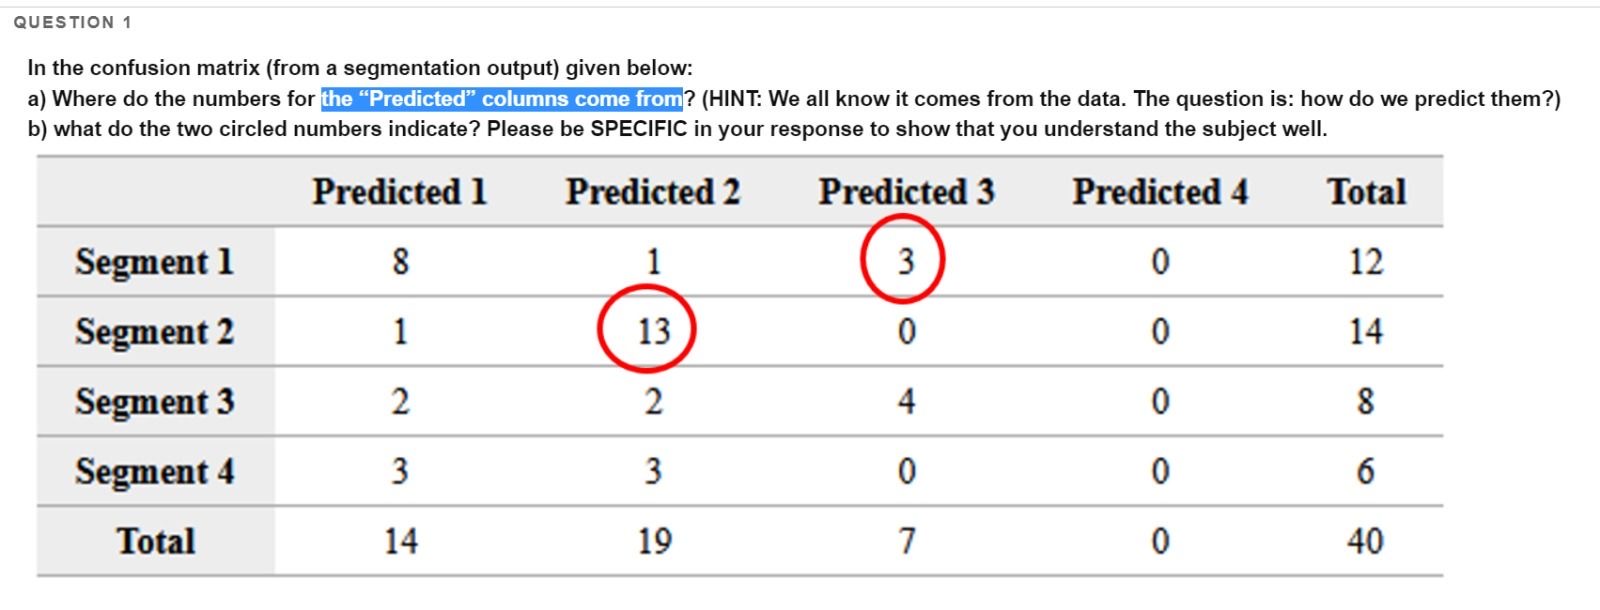
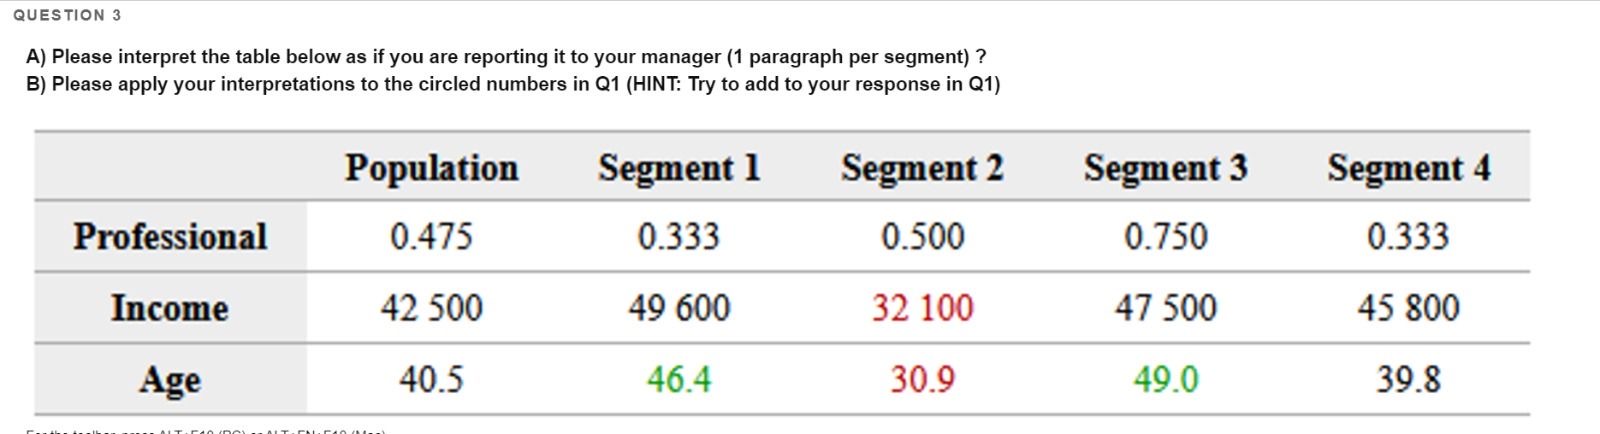
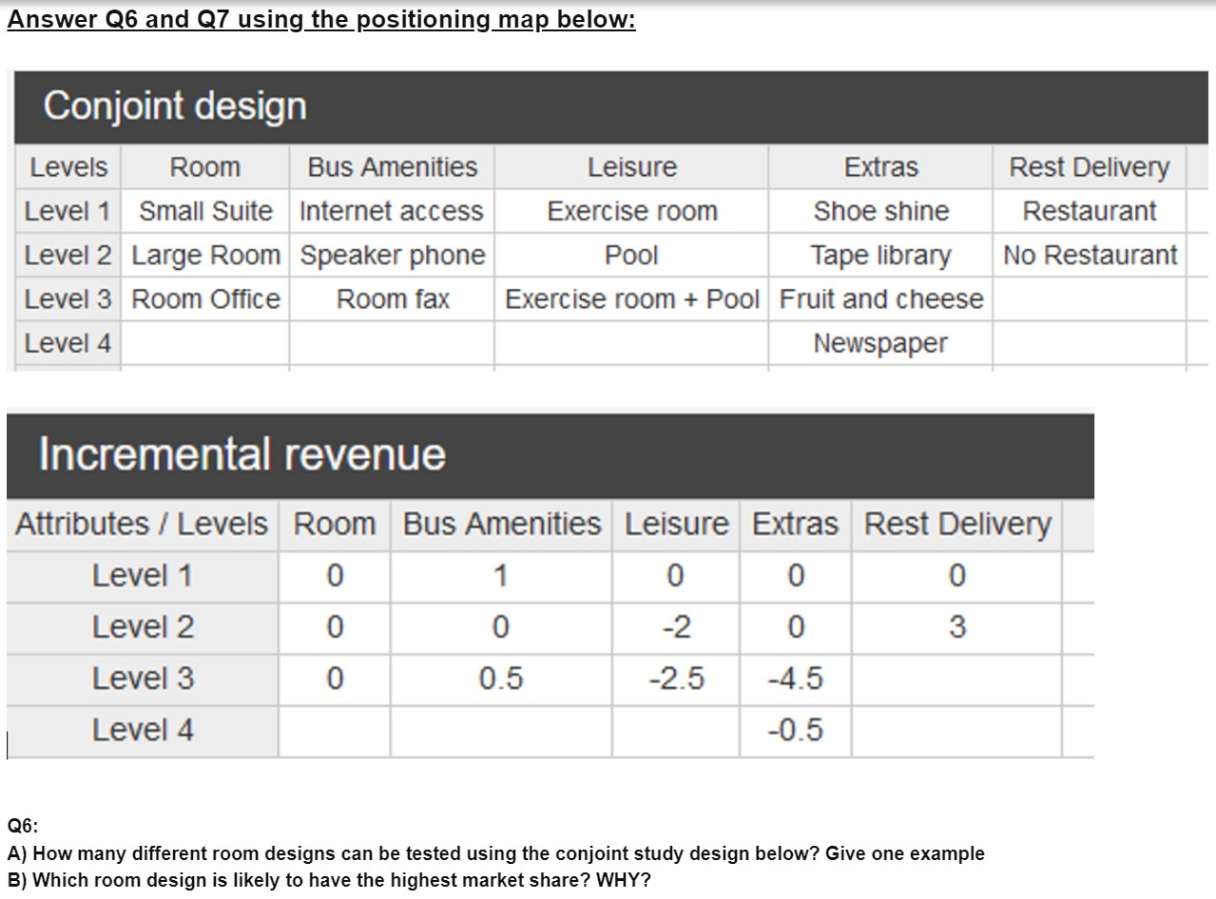


QUESTION 1 In the confusion matrix (from a segmentation output) given below: a) Where do the numbers for the "Predicted" columns come from? (HINT: We all know it comes from the data. The question is: how do we predict them?) b) what do the two circled numbers indicate? Please be SPECIFIC in your response to show that you understand the subject well. Predicted 1 Segment 1 8 Predicted 2 1 Predicted 3 Predicted 4 Total 3 0 12 Segment 2 1 13 0 0 14 Segment 3 2 2 4 0 8 Segment 4 3 3 0 0 6 Total 14 19 7 0 40 40 QUESTION 2 What is the hit rate for Segment 3? EXPLAIN AND SHOW YOUR WORK For the toolbar, press ALT+F10 (PC) or ALT+FN+F10 (Mac). QUESTION 3 A) Please interpret the table below as if you are reporting it to your manager (1 paragraph per segment)? B) Please apply your interpretations to the circled numbers in Q1 (HINT: Try to add to your response in Q1) Professional Population 0.475 Segment 1 0.333 Segment 2 Segment 3 Segment 4 0.500 0.750 0.333 Income 42 500 49 600 32 100 47 500 45 800 Age 40.5 46.4 30.9 49.0 39.8 Answer Q6 and Q7 using the positioning map below: Conjoint design Levels Room Bus Amenities Level 1 Small Suite Internet access Level 2 Large Room Speaker phone Level 3 Room Office Room fax Level 4 Leisure Extras Shoe shine Tape library Exercise room Pool Exercise room + Pool Fruit and cheese Rest Delivery Restaurant No Restaurant Newspaper Incremental revenue Attributes / Levels Room Bus Amenities Leisure Extras Rest Delivery Q6: Level 1 0 1 0 0 0 Level 2 0 0 -2 0 3 Level 3 0 0.5 -2.5 -4.5 Level 4 -0.5 A) How many different room designs can be tested using the conjoint study design below? Give one example B) Which room design is likely to have the highest market share? WHY? QUESTION 7 Based on the conjoint study design in Q6: What would you do to find the five product designs, which do not offer a pool, with the highest possible revenue? (Please be specific in your response) QUESTION 11 Q11 (EXTRA CREDIT): how do we calculate the "Improvement" percentages in the Lift Table?
Step by Step Solution
There are 3 Steps involved in it

Get step-by-step solutions from verified subject matter experts