

Question: Question 1 - Internet market . Your goal is data analysis/interpretation from the data below. You must create graphs via Excel and attach them. a)
Question 1 - Internet market. Your goal is data analysis/interpretation from the data below. You must create graphs via Excel and attach them.
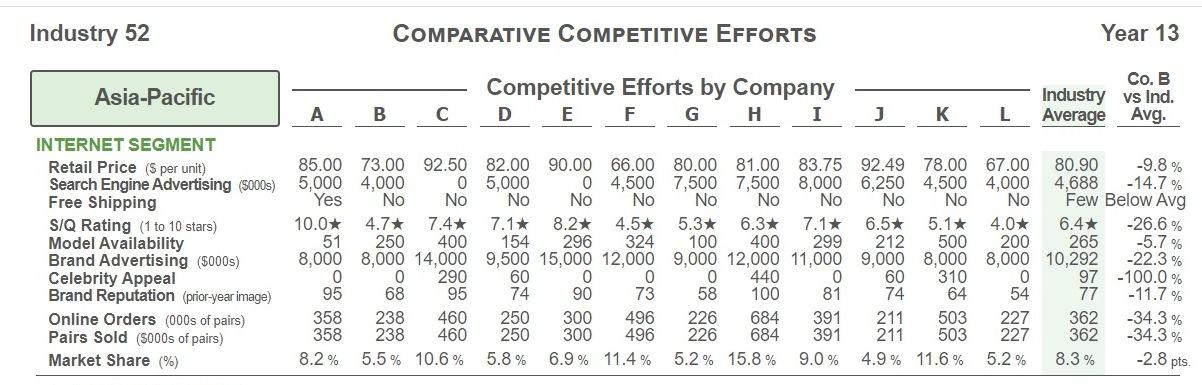
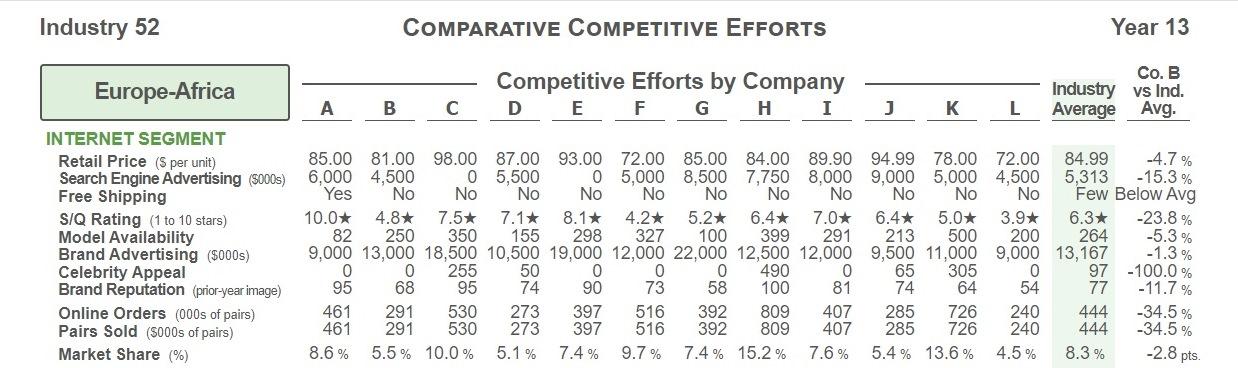
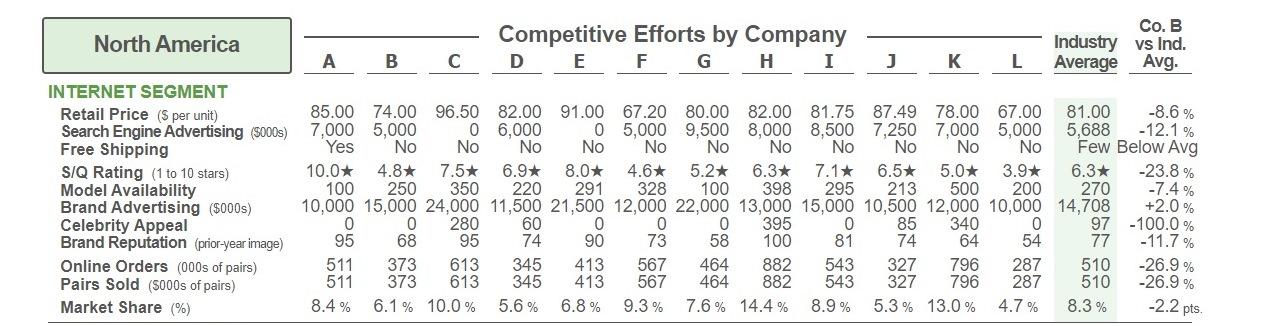
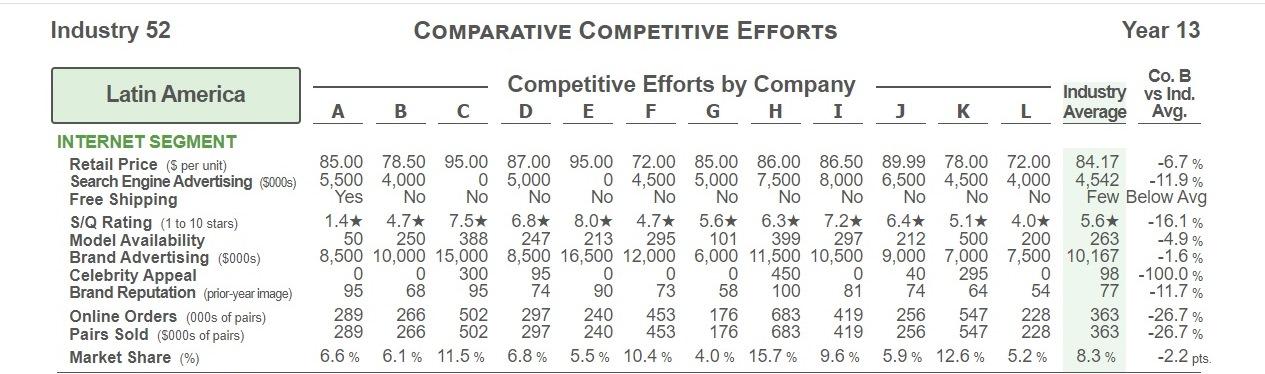
a) Create a Strategy Group map for each geographic region for Year 13 with Price on the X-Axis and SQ on the Y-axis. Create graphs in excel, add them here, and then explain.
b) Data on company B and top 2 competitors on the following metrics. Create graphs in excel, add them here, and then explain.
Number of Models
Search engine advertising
Free shipping, yes or no variable
c) Follow the data with a discussion of who is your primary competitor in each region and why do they command their current market share? What will you do to compete?
Industry 52 Comparative Competitive EfForts Year 13 Industry 52 COMPARATIVE COMPETITIVE EFforts Year 13 Industry 52 Comparative Competitive EfForts Year 13 Industry 52 COMPARATIVE COMPETITIVE EFforts Year 13
Step by Step Solution
There are 3 Steps involved in it

Get step-by-step solutions from verified subject matter experts