

Question: Question 1 Is there a relationship between car purchases and political party? You make a tabulation of people who were asked about the origin of
Question 1
Is there a relationship between car purchases and political party? You make a tabulation of people who were asked about the origin of their primary car and their political party affiliation. To determine if Political Party and Car Origin are dependent, what are the appropriate hypotheses?
Question 1 options:
1)
HO: Political Party and Car Origin are not related to each other.
HA: Political Party and Car Origin are dependent on one another.
2)
There is not enough information to choose the correct set of hypotheses.
3)
HO: Political Party and Car Origin are dependent on one another.
HA: Political Party and Car Origin are not related to one another.
4)
HO: Political Party and Car Origin are independent of each other.
HA: Political Party and Car Origin display a negative correlation.
5)
HO: Political Party and Car Origin are not related to one another.
HA: Political Party and Car Origin display a positive correlation.
Question 2
You notice that the type of phone someone has and the computer operating system they use seems to be related. Based on a sample, you make the following tabulation. To test at the 0.01 level to determine if Phone and Computer OS are dependent, calculate the chi-square test statistic and p-value. (see picture attachment)
Question 2 options:
1)
None of the other options are fully correct.
2)
10.531, the degrees of freedom is 6, and the p-value is 0.1040.
3)
10.531, the degrees of freedom is 2, and the p-value is 0.0052.
4)
10.531, the degrees of freedom is 2, and the p-value is 0.0100.
5)
3.045, the degrees of freedom is 2, and the p-value is 0.9948.
Question 3
A political poll asked potential voters if they felt the economy was going to get worse, stay the same, or get better during the next 12 months. The party affiliations of the respondents were also noted. The results are shown in the following table. Identify the correct conclusion using the 0.05 level of significance. (see picture attachment)
Question 3 options:
1)
We find that Party Affiliation and Response are independent of each other, based on a p-value of 0.0104
2)
There is no correct answer.
3)
We find that Party Affiliation and Response are dependent on one another, based on a p-value of 0.0104
4)
We determine that Party Affiliation and Response are associated with one another, based on a p-value of 0.9896
5)
We decide that Party Affiliation and Response are not related to one another, based on a p-value of 0.9896
Question 4
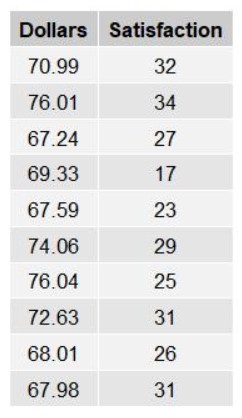
With the growth of internet service providers, a researcher decides to examine whether there is a correlation between cost of internet service per month and degree of customer satisfaction (higher scores mean high satisfaction). The researcher only includes programs with comparable types of services. Calculate the Pearson's correlation coefficient for the dataset below and interpret what that means. (see picture attachment)
Question 4 options:
1)
The correlation is 0.373 . There is a perfect positive linear association between Dollars and Satisfaction .
2)
The correlation is 0.373 . There is a moderate positive linear association between Dollars and Satisfaction .
3)
The correlation is -0.373 . There is a moderate negative linear association between Dollars and Satisfaction .
4)
The correlation is 0.373 . There is a moderate negative linear association between Dollars and Satisfaction .
5)
The correlation is -0.373 . There is a moderate positive linear association between Dollars and Satisfaction .
Question 5
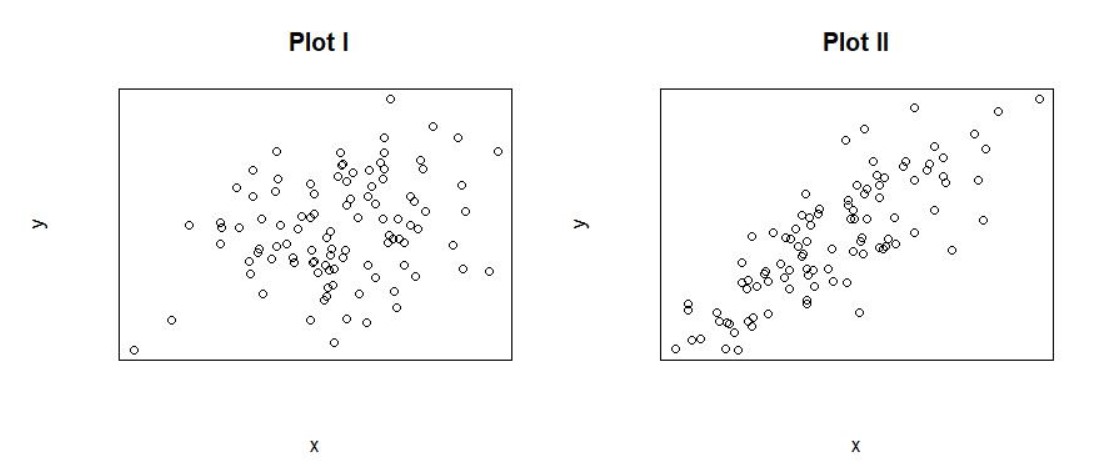
Choose the value of the Pearson's Correlation Coefficient (r) that best describes the two plots. (see picture attachment)
Question 5 options:
1)
I: -0.273, II: -0.815.
2)
I: 0.273, II: 0.815.
3)
I: 0.273, II: 0.415.
4)
I: -0.127, II: 0.815.
5)
I: 0.815, II: 0.673.
Question 6
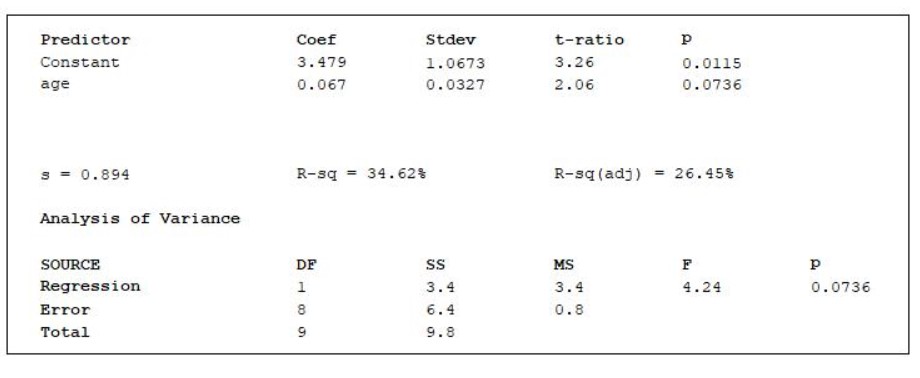
While attempting to measure its risk exposure for the upcoming year, an insurance company notices a trend between the age of a customer and the number of claims per year. It appears that the number of claims keep going up as customers age. If 10 customers are sampled and the regression output is given below, report the regression equation. (see picture attachment)
Question 6 options:
1)
(age) = 0.067*(number of claims per year) + 3.479
2)
(number of claims per year) = 3.479*(age) + 0.067
3)
(number of claims per year) = 0.067*(age)
4)
(age) = 3.479*(number of claims per year) + 0.067
5)
(number of claims per year) = 0.067*(age) + 3.479
Question 7
You work for a company in the marketing department. Your manager has tasked you with forecasting sales by month for the next year. You notice that over the past 12 months sales have consistently gone up in a linear fashion, so you decide to run a regression the company's sales history. You find that the regression equation for the data is (sales) = 64.26*(time) + 226.979. Assuming sales follow the same trend this year to next, what sales quantity would you expect to see in 6 months?
Question 7 options:
1)
We do not know the observations in the data set, so we cannot answer that question.
2)
612.54
3)
1426.13
4)
-3.44
5)
385.56
Question 8
You work for a company in the marketing department. Your manager has tasked you with forecasting sales by month for the next year. You notice that over the past 12 months sales have consistently gone up in a linear fashion, so you decide to find a regression equation for the company's sales history. You find that the regression equation for the data is (sales) = 24.719*(time) + 9.919. Interpret the slope.
Question 8 options:
1)
When time increases by 1 month, sales increases by 24.719 units.
2)
We are not given the dataset, so we cannot make an interpretation.
3)
When time increases by 1 month, sales increases by 9.919 units.
4)
When sales increases by 1 unit, time increases by 9.919 months.
5)
When sales increases by 1 unit, time increases by 24.719 months.
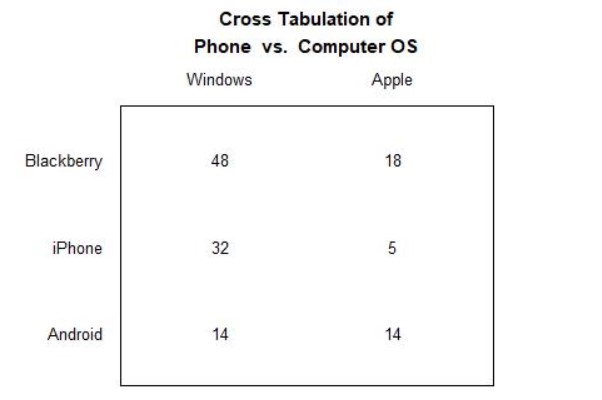
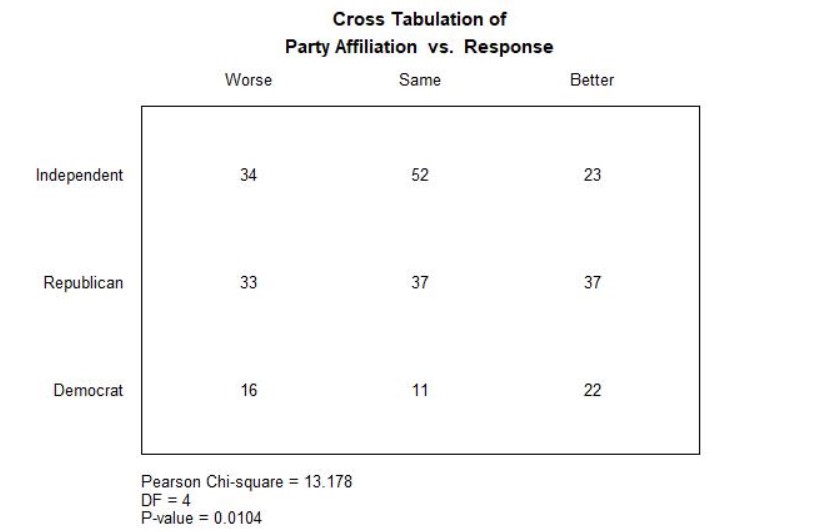
Cross Tabulation of Phone vs. Computer OS Windows Apple Blackberry 48 18 iPhone 32 Android 14 14Cross Tabulation of Party Affiliation vs. Response Worse Same Better Independent 34 52 23 Republican 33 37 37 Democrat 16 11 22 Pearson Chi-square = 13.178 DF = 4 P-value = 0.0104\f\f\f
Step by Step Solution
There are 3 Steps involved in it

Get step-by-step solutions from verified subject matter experts