

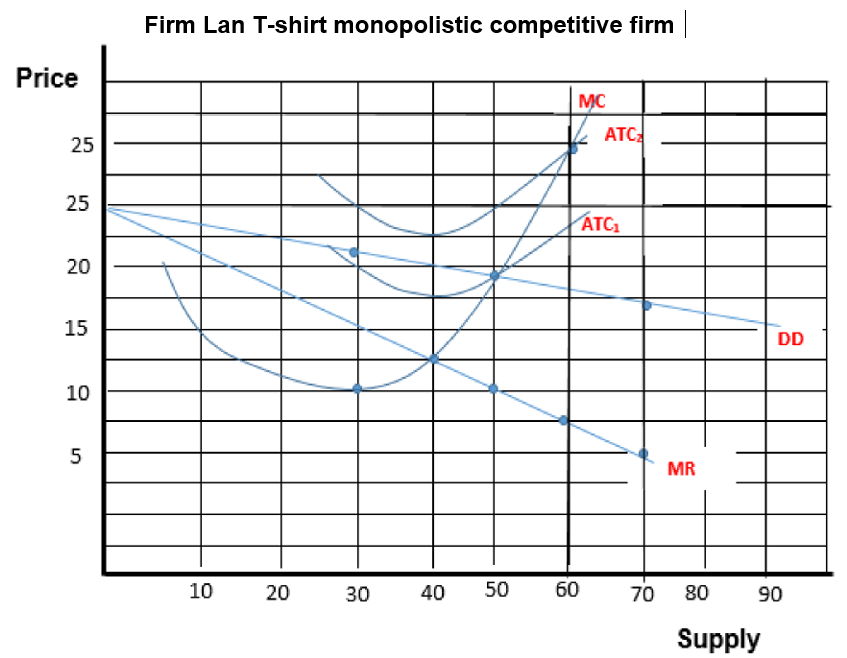
Question: Question 1 (i)Use the graph below to explain the output, profit and loss conditions for monopolistically competitive firms. Show your work where appropriate in reference
Question 1
(i)Use the graph below to explain the output, profit and loss conditions for monopolistically competitive firms. Show your work where appropriate in reference to the Graph.
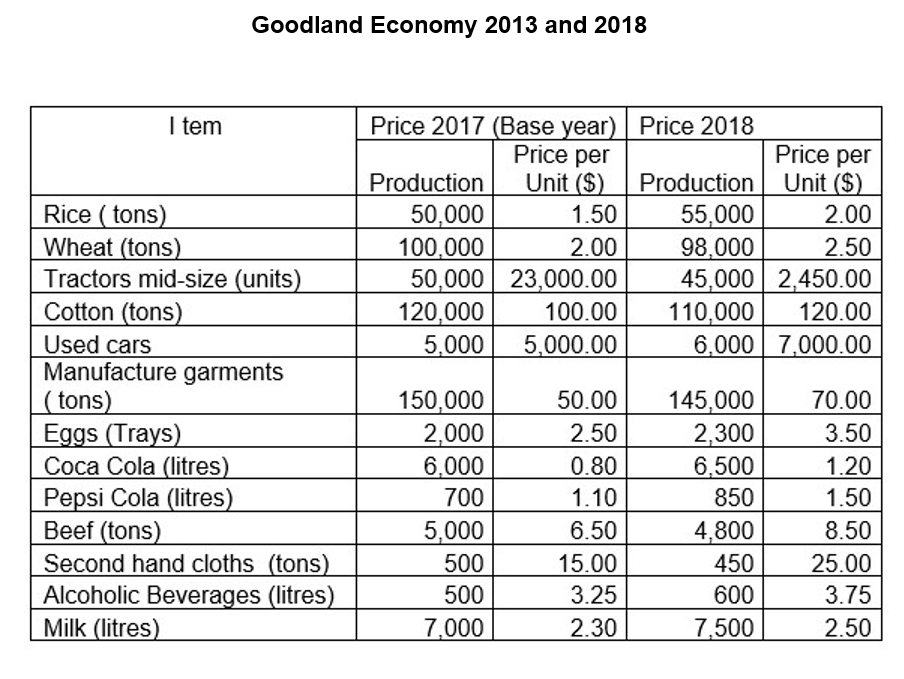
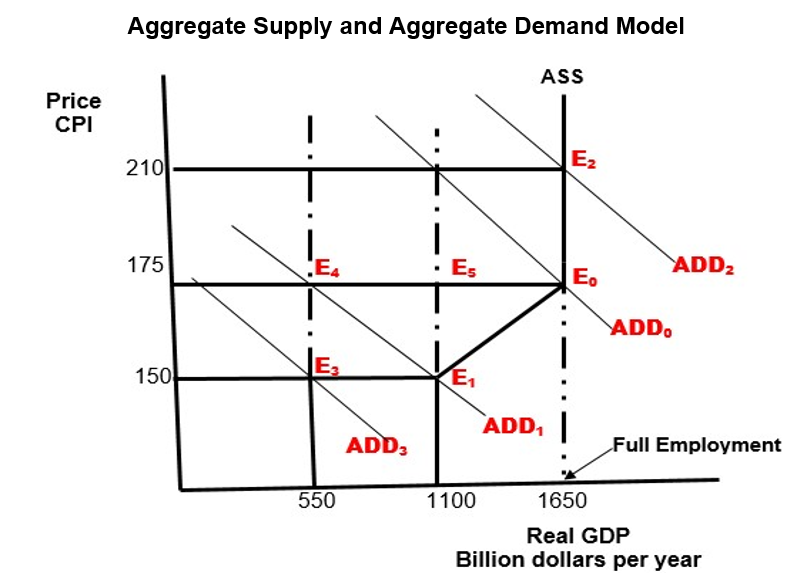
\fGoodland Economy 2013 and 2018 I tem Price 2017 (Base year) Price 2018 Price per Price per Production Unit ($) Production Unit ($) Rice ( tons) 50,000 1.50 55,000 2.00 Wheat (tons) 100,000 2.00 98,000 2.50 Tractors mid-size (units) 50,000 23,000.00 45,000 2,450.00 Cotton (tons) 120,000 100.00 110,000 120.00 Used cars 5.000 5,000.00 6,000 7,000.00 Manufacture garments tons) 150,000 50.00 145,000 70.00 Eggs (Trays) 2,000 2.50 2,300 3.50 Coca Cola (litres) 6.000 0.80 6.500 1.20 Pepsi Cola (litres) 700 1.10 850 1.50 Beef (tons) 5,000 6.50 4.800 8.50 Second hand cloths (tons) 500 15.00 450 25.00 Alcoholic Beverages (litres) 500 3.25 600 3.75 Milk (litres) 7,000 2.30 7,500 2.50Aggregate Supply and Aggregate Demand Model ASS Price CPI 210 Ez 175 CE. . Es Eo ADD2 ADD. 150 E3 E1 ADD, ADD3 Full Employment 550 1100 1650 Real GDP Billion dollars per year
Step by Step Solution
There are 3 Steps involved in it

Get step-by-step solutions from verified subject matter experts