

Question: QUESTION 1 Modelling Exercise Instructions: companies. Task 1: The first Set of Questions in the quiz are related to Task 1 . In Task 1,
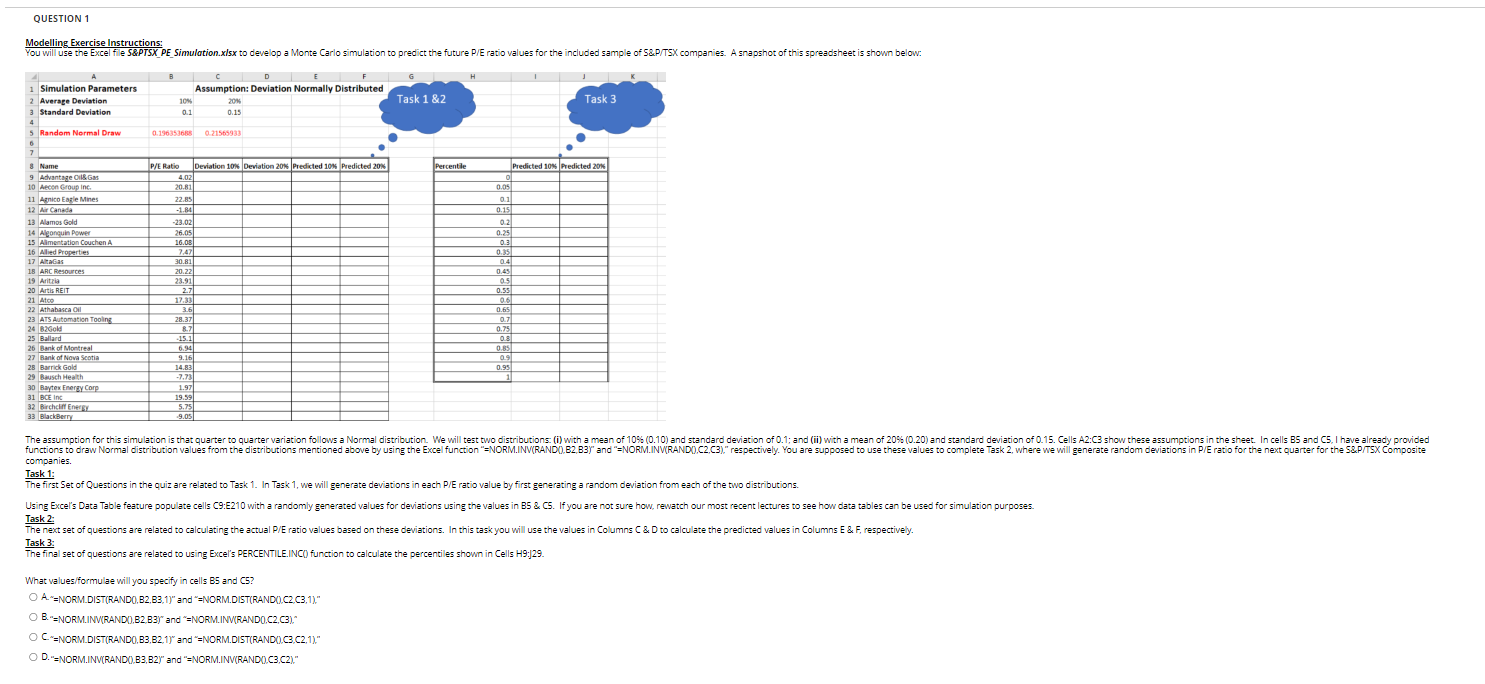
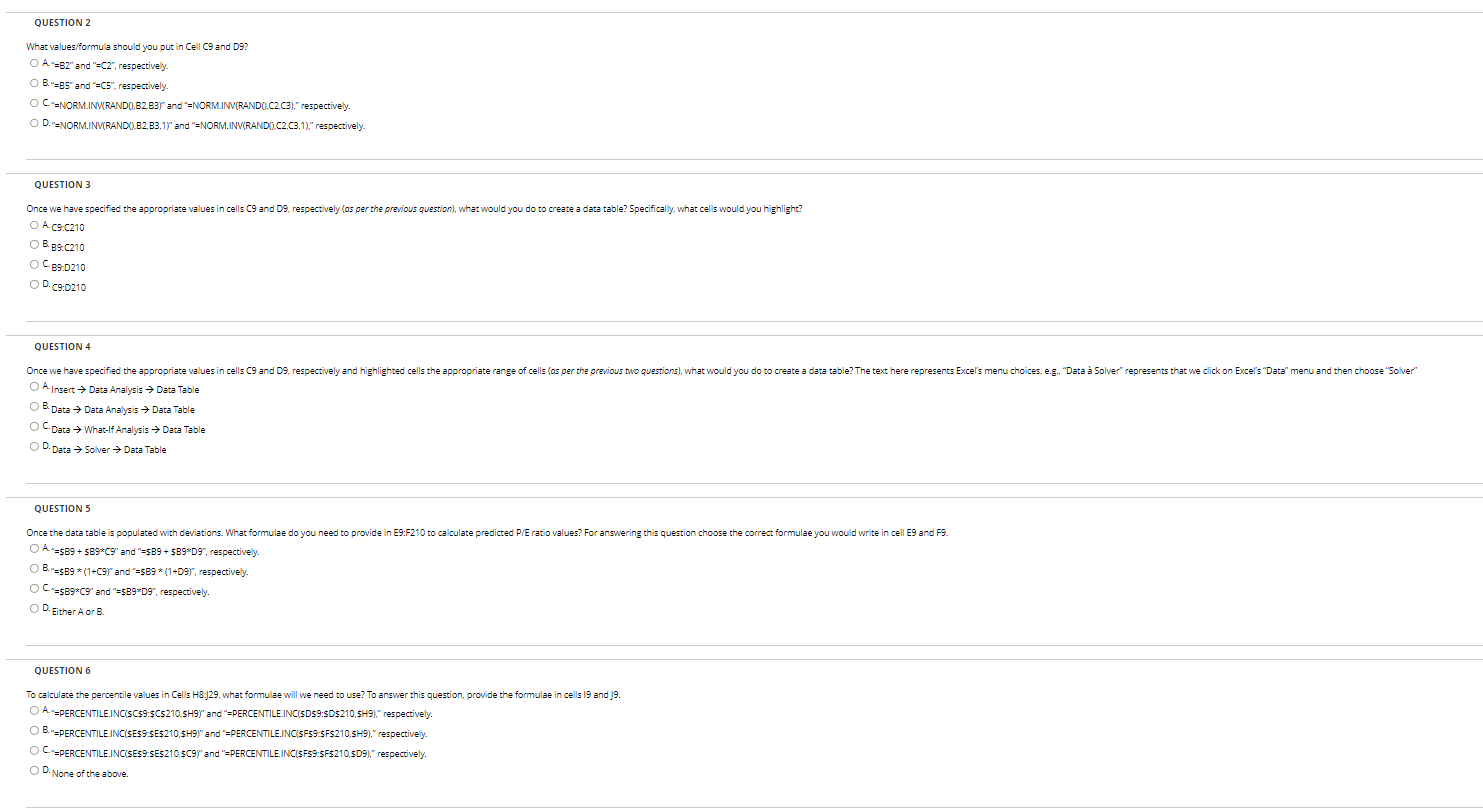
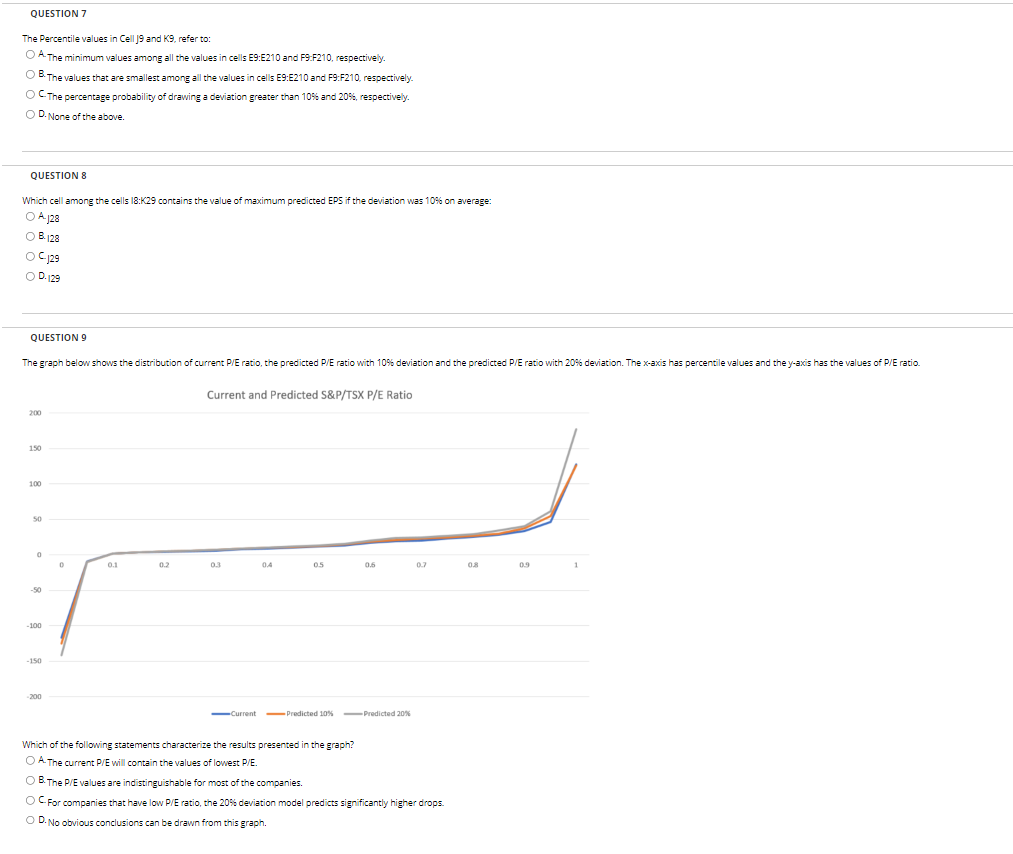
QUESTION 1 Modelling Exercise Instructions: companies. Task 1: The first Set of Questions in the quiz are related to Task 1 . In Task 1, we will generate deviations in each P/E ratio value by first generating a random deviation from each of the two distributions. Using Excel's Data Table feature populate cells C9:E210 with a randomly generated values for deviations using the values in B5 \& C5. If you are not sure how, rewatch our most recent lectures to see how data tables can be used for simulation purposes Task 2: The next set of questions are related to calculating the actual P/E ratio values based on these deviations. In this task you will use the values in Columns C\& D to calculate the predicted values in Columns E \& F, respectively. Task 3: What values/formulae will you specify in cells B5 and C5? A. " =NORM.DIST(RANDO, B2,83,1)" and "=NORM.DIST(RANDO) C2, C3, 1). B. "=NORM.INW(RANDD, B2,B3)" and "=NORM.INW(RANDO,C2, (C3)" D. "=NORM.INV(RANDO),B3,B2)" and "=NORIM.INV(RANDI, C3, C2)" QUESTION 2 What values/formula should you put in Cell C9 and D9? A."=B2 " and "=C2", respectively. B."=B5" and "=C5", respectively. O C. =NORM.INWRAND0, B2, B3)" and "=NORMLINN(RANDO, C2 C3)," respectively. D. "=NORM.INV(RANDO),B2, B3,11" and "=NORM.INV(RANDN) C2, C3,1)," respectively. QUESTION 3 Once we have specified the appropriate values in cells C9 and D9, respectively (as per the previous question), what would you do to create a data table? Specifically, what cells would you highlight? A. CgC210 B. BgC210 CB9:D210 D. C9:0210 QUESTION 4 OA. Ansert Data Analysis Data Table B. Data Data Analysis Data Table OCData Whar-If Analysis Data Table D. Data Solver Data Table QUESTION 5 Once the data table is populated with deviations. What formulae do you need to provide in E9:F210 to calculate predicted P/E ratio values? For answering this question choose the correct formulae you would write in cell E9 and F9. B=$B9(1+C9)n and =$B9(1+D9)2, respectively. C=$BgCg and "=$BgCDg ", respectively. D. Either A or B. QUESTION 6 To calculate the percentile values in Cells H8:129, what formulae will we need to use? To answer this question, provide the formulae in cells 19 and 19. A. = PERCENTILE.INC(\$C\$9:\$C\$210,\$H9)" and "=PERCENTILE.INC(\$D\$9:\$D\$210,\$H9)," respectively. B."=PERCENTILE.INC(\$E\$9:\$E\$210,\$H9)" and "=PERCENTLE.INC(\$F\$9-\$F\$210, sH9)," respectively. C=PERCENTILE.INC(SE\$9:SE\$210,\$C9)" and "=PERCENTILE.INC(\$FS9:\$F\$210,\$D9)," respectively. D. None of the above. QUESTION 7 The Percentile values in Cell 19 and K9, refer to: A. The minimum values among all the values in cells E9:E210 and F9:F210, respectively. B. The values that are smallest among all the values in cells E9:E210 and F9:F210, respectively- C - The percentage probability of drawing deviation greater than 10% and 20%, respectively. D. None of the above. QUESTION 8 Which cell among the cells 18:K29 contains the value of maximum predicted EPS if the deviation was 10\% on average: A.j28 B. 128 C129 D. 129 QUESTION 9 150 200 Which of the following statements characterize the results presented in the graph? A. The current P/E will contain the values of lowest P/E. B. The P/E values are indistinguishable for most of the companies. C For companies that have low P/E ratio, the 20% deviation model predicts significantly higher drops. D. No obvious conclusions can be drawn from this graph. QUESTION 1 Modelling Exercise Instructions: companies. Task 1: The first Set of Questions in the quiz are related to Task 1 . In Task 1, we will generate deviations in each P/E ratio value by first generating a random deviation from each of the two distributions. Using Excel's Data Table feature populate cells C9:E210 with a randomly generated values for deviations using the values in B5 \& C5. If you are not sure how, rewatch our most recent lectures to see how data tables can be used for simulation purposes Task 2: The next set of questions are related to calculating the actual P/E ratio values based on these deviations. In this task you will use the values in Columns C\& D to calculate the predicted values in Columns E \& F, respectively. Task 3: What values/formulae will you specify in cells B5 and C5? A. " =NORM.DIST(RANDO, B2,83,1)" and "=NORM.DIST(RANDO) C2, C3, 1). B. "=NORM.INW(RANDD, B2,B3)" and "=NORM.INW(RANDO,C2, (C3)" D. "=NORM.INV(RANDO),B3,B2)" and "=NORIM.INV(RANDI, C3, C2)" QUESTION 2 What values/formula should you put in Cell C9 and D9? A."=B2 " and "=C2", respectively. B."=B5" and "=C5", respectively. O C. =NORM.INWRAND0, B2, B3)" and "=NORMLINN(RANDO, C2 C3)," respectively. D. "=NORM.INV(RANDO),B2, B3,11" and "=NORM.INV(RANDN) C2, C3,1)," respectively. QUESTION 3 Once we have specified the appropriate values in cells C9 and D9, respectively (as per the previous question), what would you do to create a data table? Specifically, what cells would you highlight? A. CgC210 B. BgC210 CB9:D210 D. C9:0210 QUESTION 4 OA. Ansert Data Analysis Data Table B. Data Data Analysis Data Table OCData Whar-If Analysis Data Table D. Data Solver Data Table QUESTION 5 Once the data table is populated with deviations. What formulae do you need to provide in E9:F210 to calculate predicted P/E ratio values? For answering this question choose the correct formulae you would write in cell E9 and F9. B=$B9(1+C9)n and =$B9(1+D9)2, respectively. C=$BgCg and "=$BgCDg ", respectively. D. Either A or B. QUESTION 6 To calculate the percentile values in Cells H8:129, what formulae will we need to use? To answer this question, provide the formulae in cells 19 and 19. A. = PERCENTILE.INC(\$C\$9:\$C\$210,\$H9)" and "=PERCENTILE.INC(\$D\$9:\$D\$210,\$H9)," respectively. B."=PERCENTILE.INC(\$E\$9:\$E\$210,\$H9)" and "=PERCENTLE.INC(\$F\$9-\$F\$210, sH9)," respectively. C=PERCENTILE.INC(SE\$9:SE\$210,\$C9)" and "=PERCENTILE.INC(\$FS9:\$F\$210,\$D9)," respectively. D. None of the above. QUESTION 7 The Percentile values in Cell 19 and K9, refer to: A. The minimum values among all the values in cells E9:E210 and F9:F210, respectively. B. The values that are smallest among all the values in cells E9:E210 and F9:F210, respectively- C - The percentage probability of drawing deviation greater than 10% and 20%, respectively. D. None of the above. QUESTION 8 Which cell among the cells 18:K29 contains the value of maximum predicted EPS if the deviation was 10\% on average: A.j28 B. 128 C129 D. 129 QUESTION 9 150 200 Which of the following statements characterize the results presented in the graph? A. The current P/E will contain the values of lowest P/E. B. The P/E values are indistinguishable for most of the companies. C For companies that have low P/E ratio, the 20% deviation model predicts significantly higher drops. D. No obvious conclusions can be drawn from this graph
Step by Step Solution
There are 3 Steps involved in it

Get step-by-step solutions from verified subject matter experts