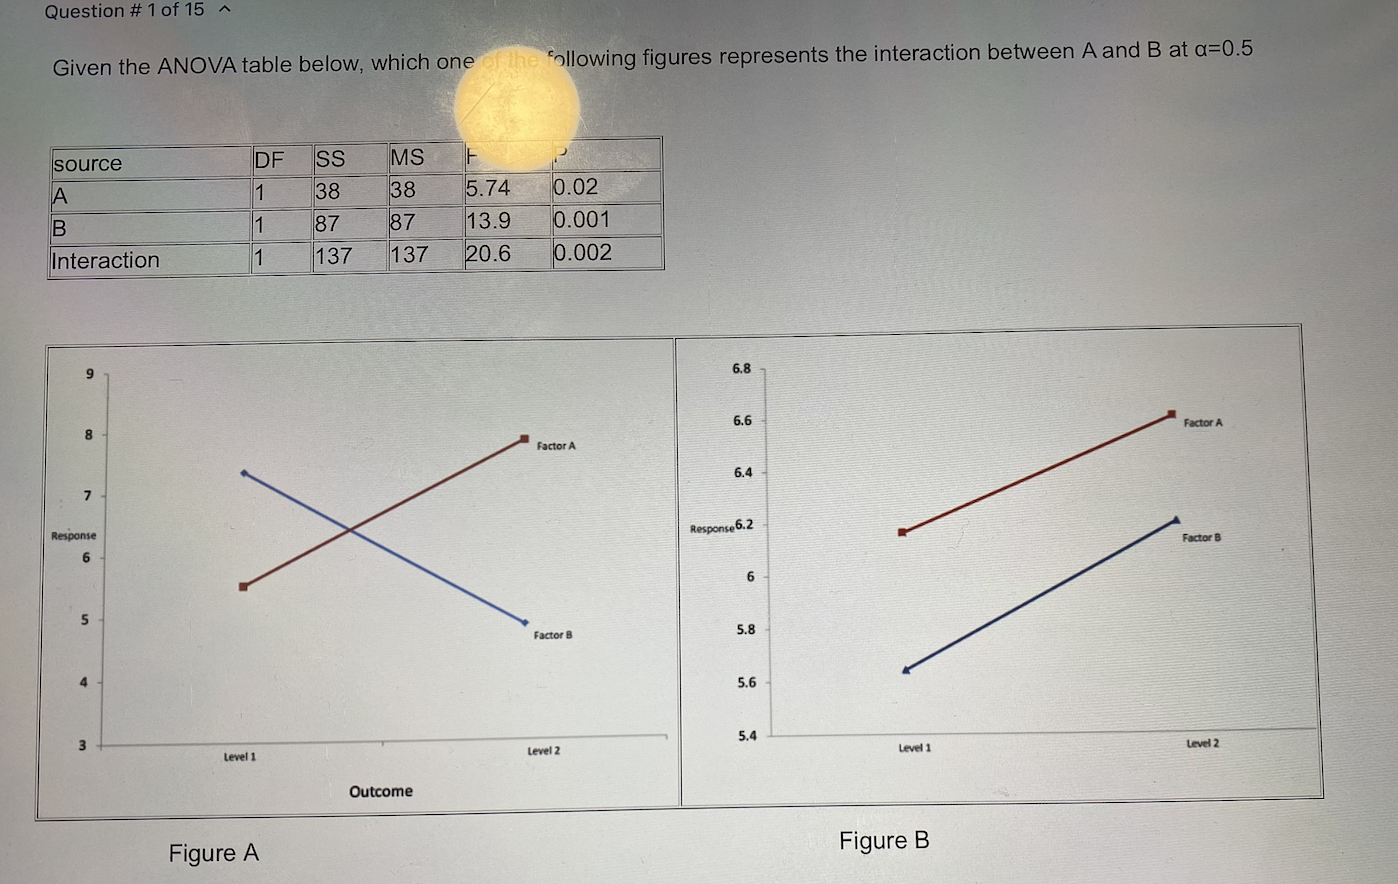
Question: Question #1 of 15 Given the ANOVA table below, which one of the following figures represents the interaction between A and B at a=0.5 source

Question #1 of 15 Given the ANOVA table below,

Question #1 of 15 Given the ANOVA table below, which one of the following figures represents the interaction between A and B at a=0.5 source DF SS F MS 38 A 38 1 1 1 B 87 137 5.74 13.9 20.6 87 137 0.02 0.001 0.002 Interaction 9 6.8 6.6 Factor A 8 Factor A 6.4 7 Response 6.2 Response Factor 3 6 6 5 Factor B 5.8 actor 3 4 5.6 5.4 3 Level 2 Level 1 Level 2 Level 1 Outcome Figure A Figure B

Step by Step Solution

There are 3 Steps involved in it

1 Expert Approved Answer
Step: 1 Unlock blur-text-image
Question Has Been Solved by an Expert!

Get step-by-step solutions from verified subject matter experts

Step: 2 Unlock
Step: 3 Unlock

Students Have Also Explored These Related General Management Questions!