

Question: Question 1 Ongoing Analysis Project An important part of learning is application. To learn accounting, we must practice the skills taught and apply those skills
Question 1
Ongoing Analysis Project
An important part of learning is application. To learn accounting, we must practice the skills taught and apply those skills to real-world problems. To that end, we have designed a project to reinforce the lessons in each module and apply them to real world companies. By working through the questions in each module, you will complete a comprehensive analysis of two publicly traded companies that operating in roughly the same industry: Parker Hannifin and Illinois Tool Works. Questions require you to calculate and interpret a wide range of ratios. In later modules, you will create a set of forecasted financial statements for each company and then estimate a value for each company's equity. The analysis in this project is similar to the analysis performed by financial analysts, lenders, and investors. You might not aspire to those roles, but by completing a project of this magnitude, you will have mastered financial reporting at a sufficient level to be able to step into any role in an organization.
Obtain financial statements
- Download the 2022 Excel financial statements for each company.
Park HannifinIllinois Tool Works
- Download each company's 2022 annual report.
Park HannifinIllinois Tool Works NOTE: You might notice some small differences between the financials in the Excel spreadsheets and those in the annual reports. The Excel version has been prepared for learning purposes and differ from the annual reports in a few places. One difference is the Excel balance sheet includes four years as compared to the two years presented in the annual report. We added more years so that you can calculate ratios for three years (more about that later). Other differences relate to presentation and style. For example, neither company includes a line for "Gross profit" in their income statement and Parker Hannifin also omitted a line for "Operating income." The Excel spreadsheet shows those two items (and others) to make the financial statements consistent with the textbook examples and with the other company.
For your submitted work, you should ALWAYS use the Excel version of the financial statements so that your answers are consistent with the solutions provided.
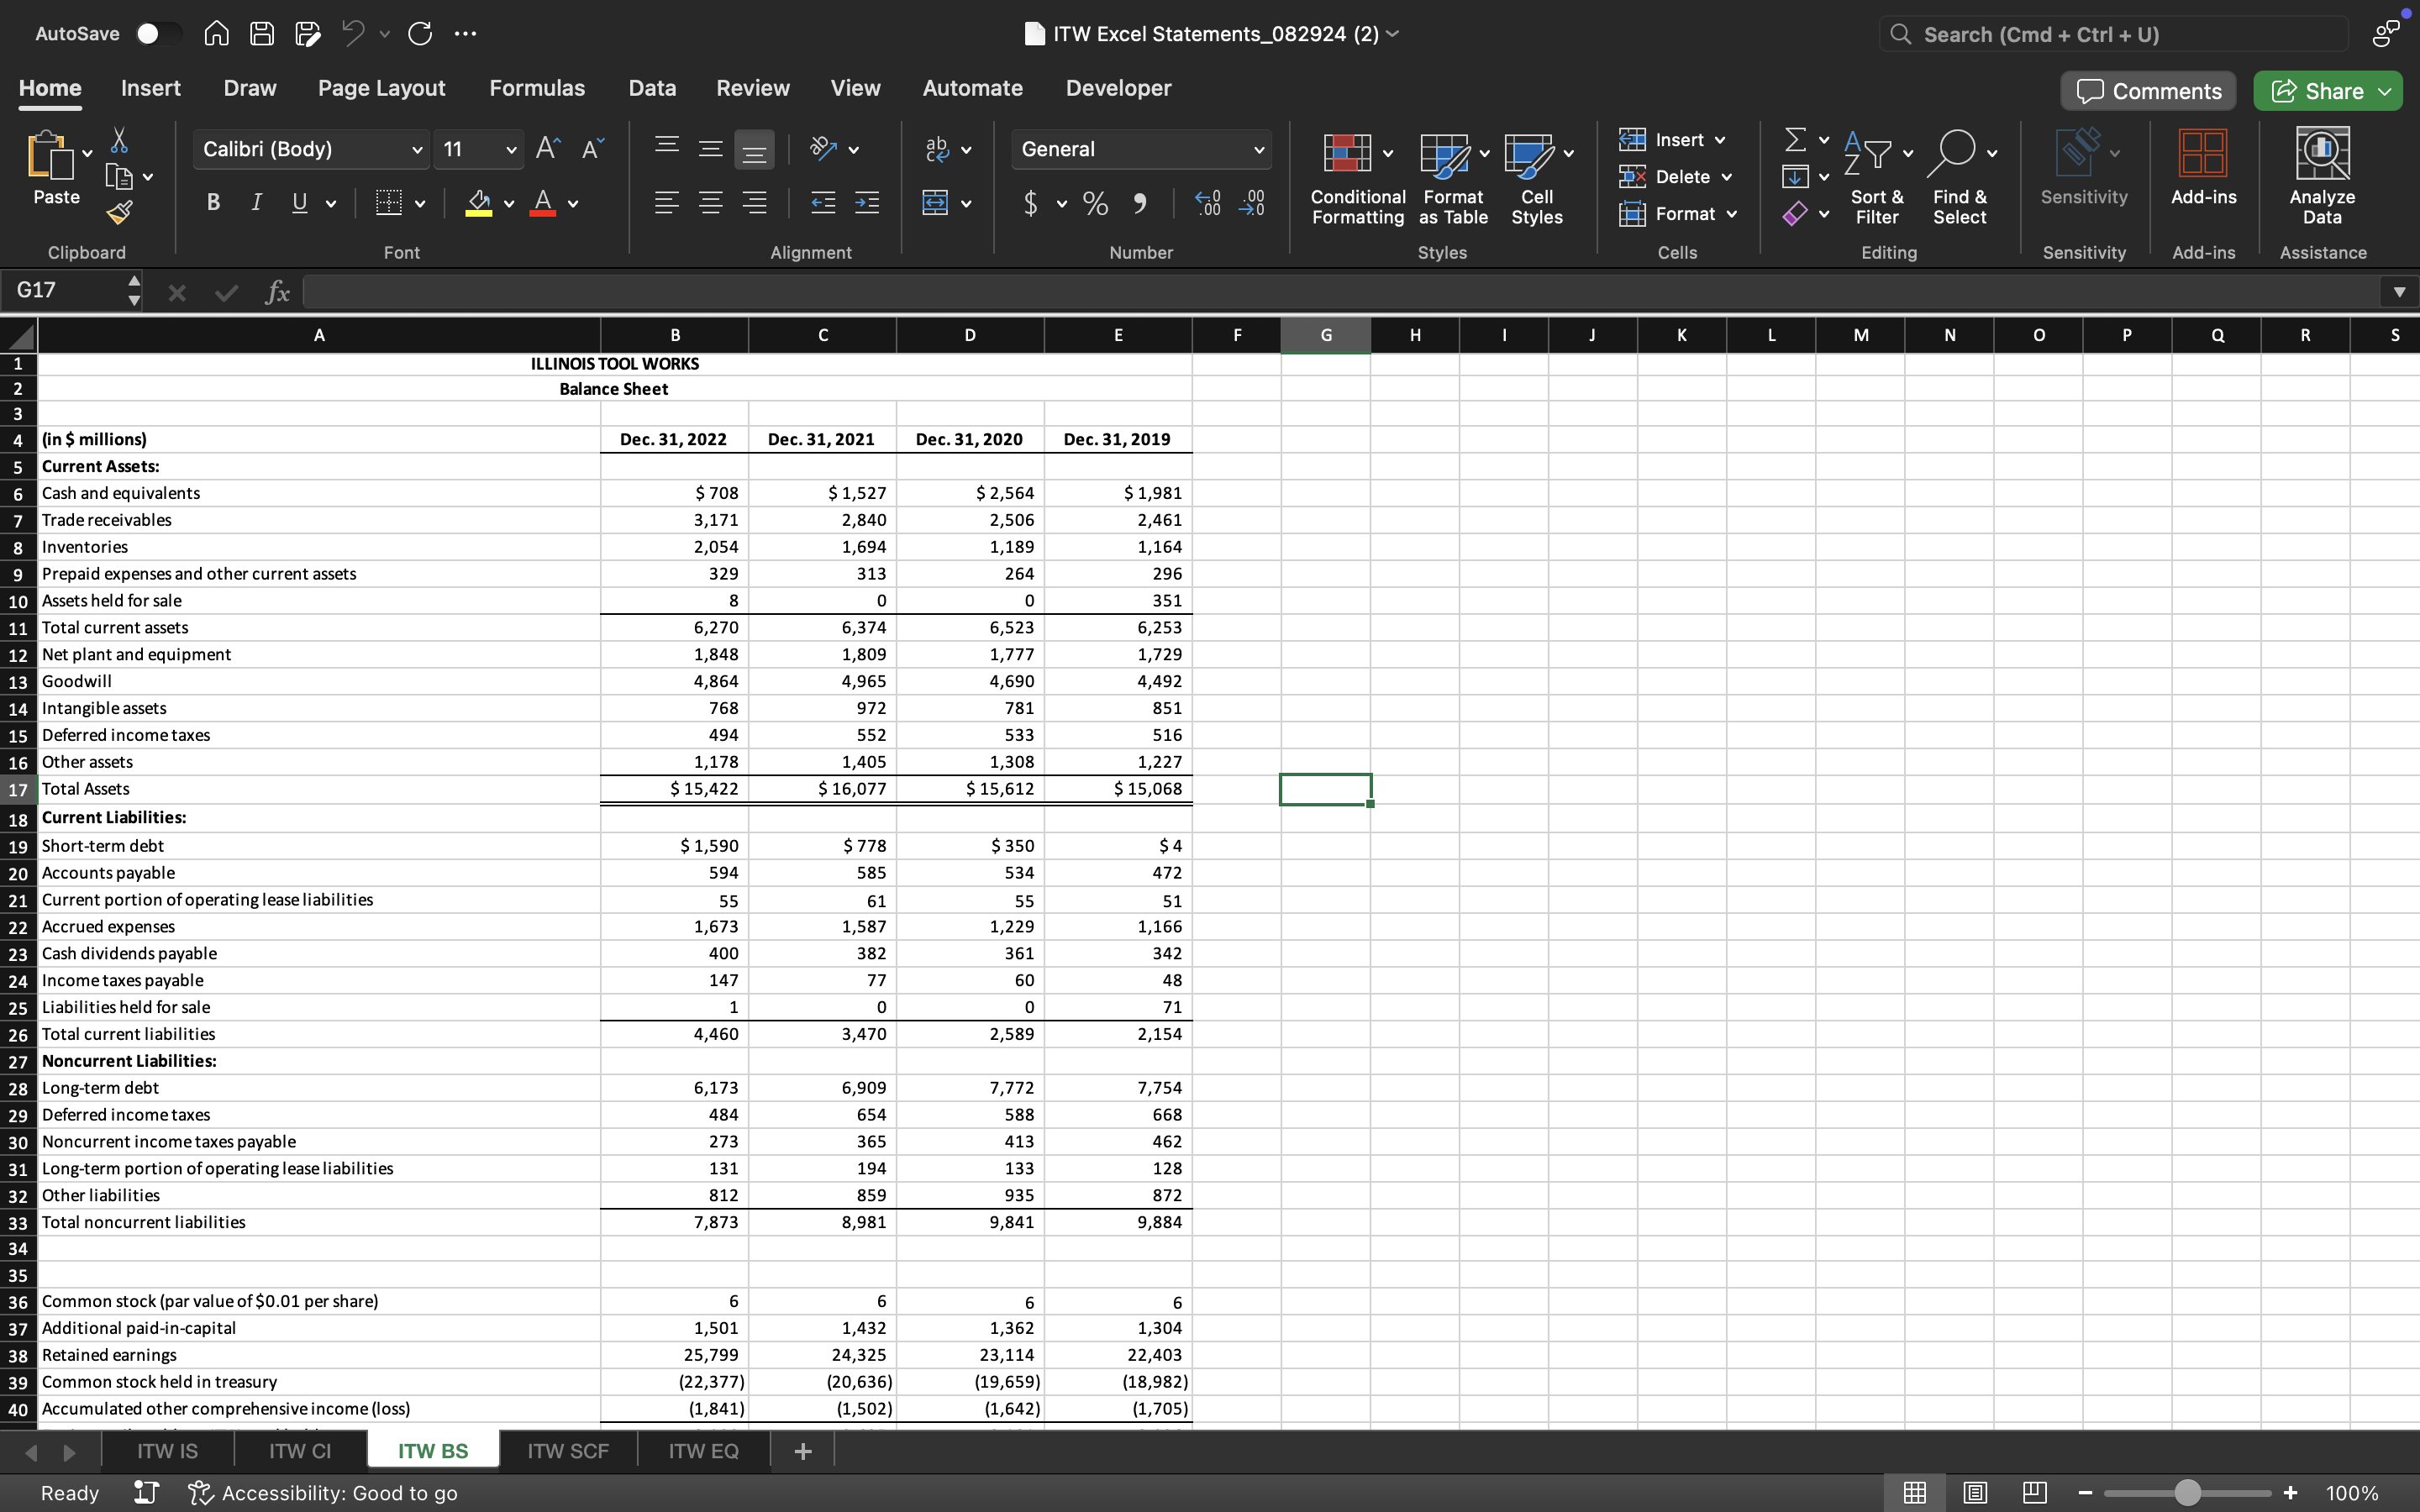
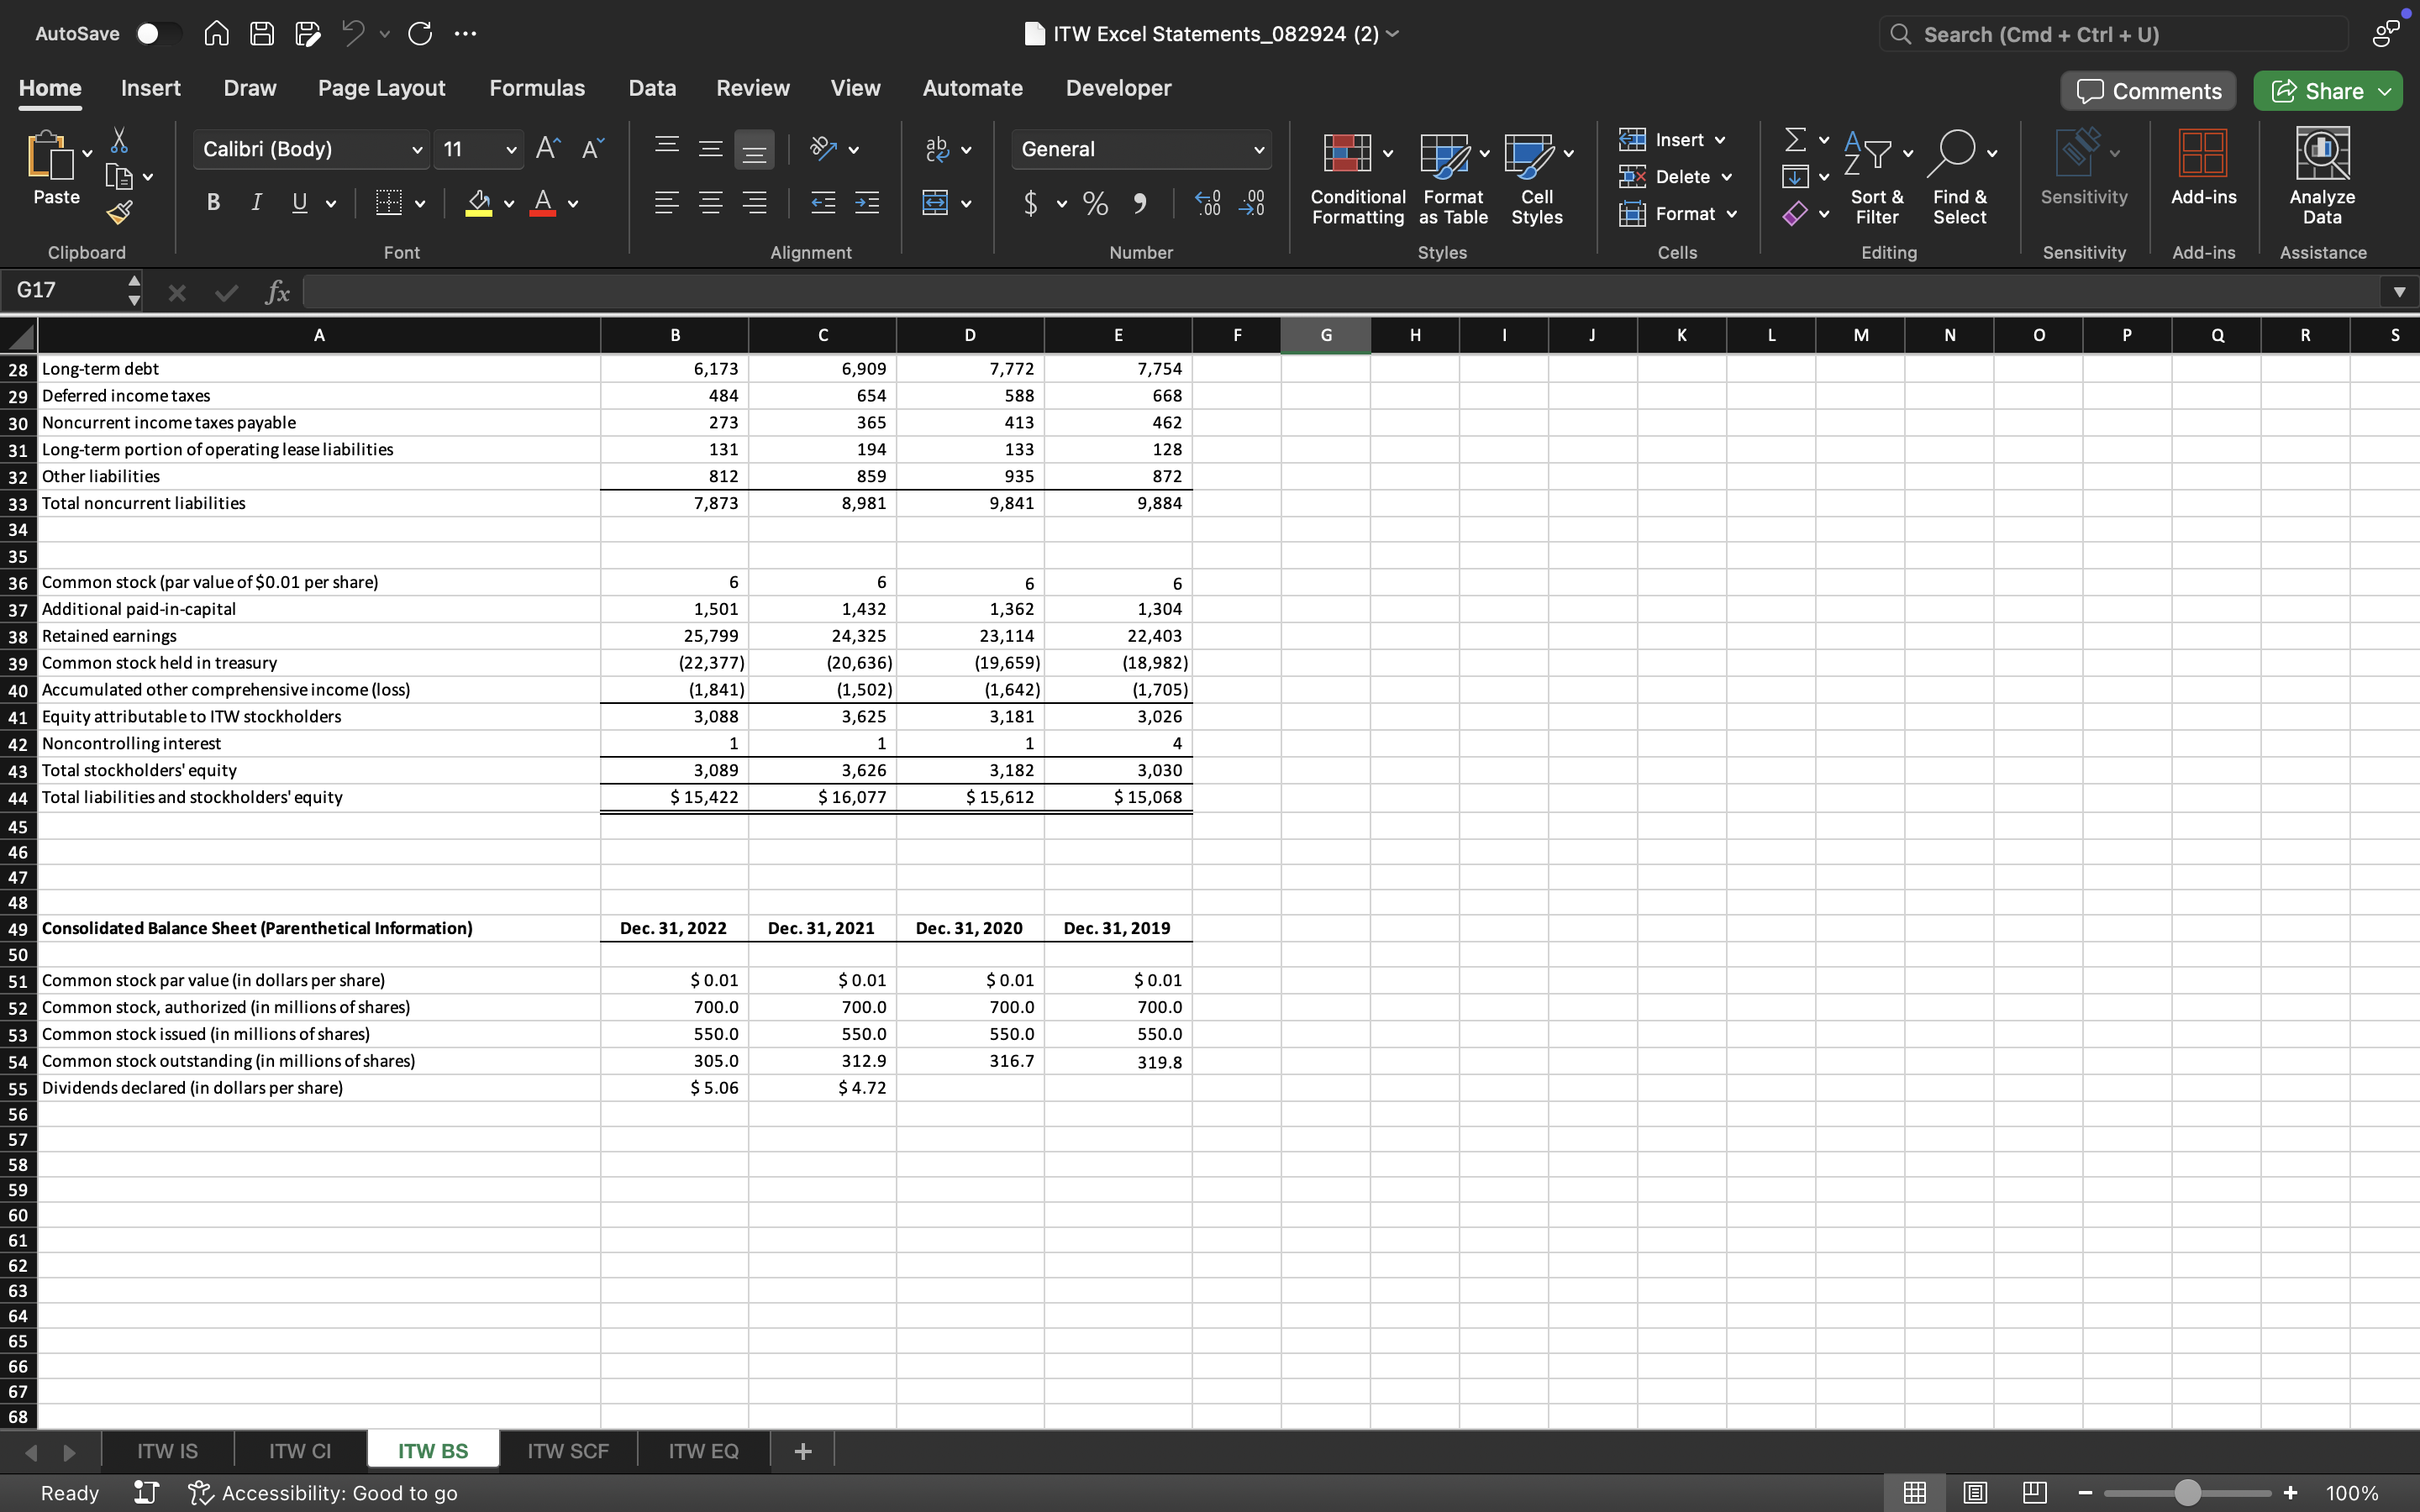
Balance sheet analysis
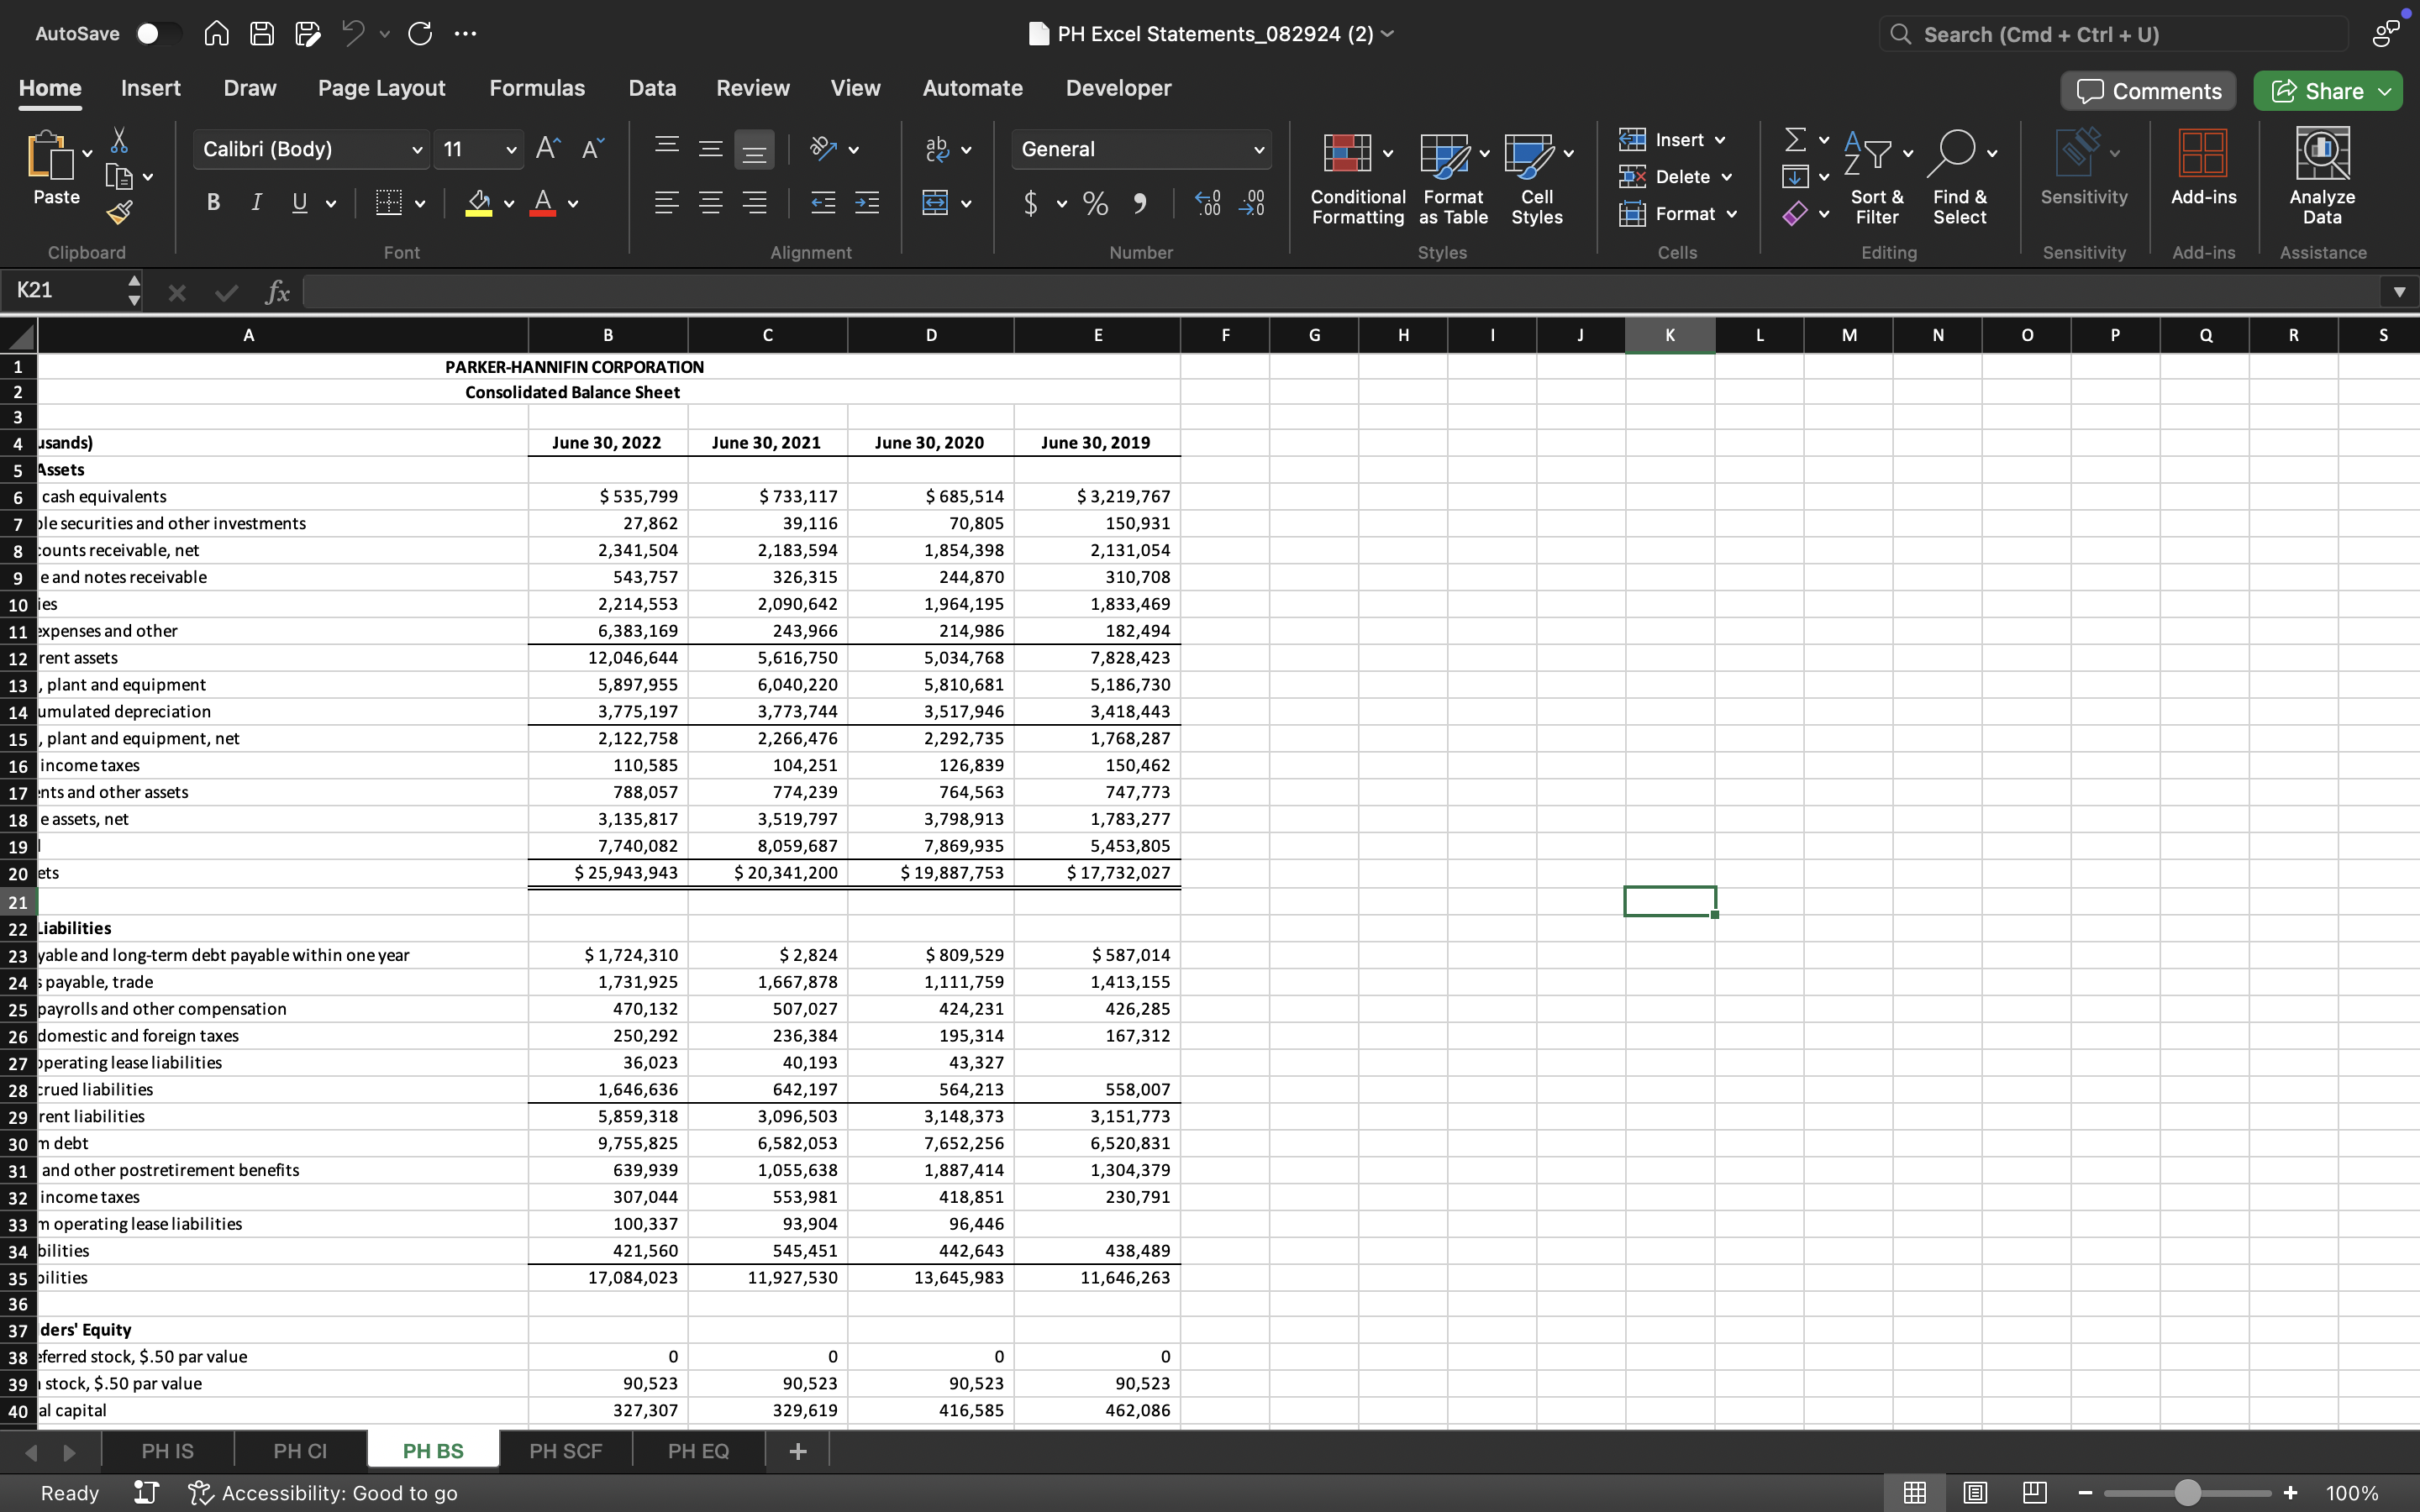
Using the balance sheet tab in the Excel financial statements files, prepare a common-size balance sheet for each company. Express each line on the balance sheet as a percent of total assets. Do this for all years on the balance sheet. Look for major differences over time and between the companies. Use the common size balance sheet to answer the following questions. (a) What are the company's two largest assets in 2022 ranked in order and their respective percentage shares of the total assets? Note: Round to the nearest whole percentage point; for example, enter 60 for 60.4% or 61 for 60.5%.
| Ranking | Parker Hannifin | ||
|---|---|---|---|
| #1 | Answer 1 Choose the correct account Cash and equivalents Trade receivables Inventories Prepaid expenses and other current assets Assets held for sale Net plant and equipment GoodwillIntangible assets Deferred income taxes - asset Other assetsShort-term debt Accounts payable Current portion of operating lease liabilities Accrued expenses Cash dividends payable Income taxes payable Liabilities held for sale Long-term debt Deferred income taxes - liabilities Noncurrent income taxes payable Long-term portion of operating lease liabilities Other liabilitiesCommon stock Additional paid-in-capital Retained earningsCommon stock held in treasury Accumulated other comprehensive income (loss) Equity attributable to ITW stockholders Noncontrolling interest
| Answer 2
| |
| #2 | Answer 3 Choose the correct account Cash and equivalents Trade receivables Inventories Prepaid expenses and other current assets Assets held for sale Net plant and equipment GoodwillIntangible assets Deferred income taxes - asset Other assetsShort-term debt Accounts payable Current portion of operating lease liabilities Accrued expenses Cash dividends payable Income taxes payable Liabilities held for sale Long-term debt Deferred income taxes - liabilities Noncurrent income taxes payable Long-term portion of operating lease liabilities Other liabilitiesCommon stock Additional paid-in-capital Retained earningsCommon stock held in treasury Accumulated other comprehensive income (loss) Equity attributable to ITW stockholders Noncontrolling interest
| Answer 4
|
| Ranking | Illinois Tool Works | ||
|---|---|---|---|
| #1 | Answer 5 Choose the correct account Cash and equivalents Trade receivables Inventories Prepaid expenses and other current assets Assets held for sale Net plant and equipment GoodwillIntangible assets Deferred income taxes - asset Other assetsShort-term debt Accounts payable Current portion of operating lease liabilities Accrued expenses Cash dividends payable Income taxes payable Liabilities held for sale Long-term debt Deferred income taxes - liabilities Noncurrent income taxes payable Long-term portion of operating lease liabilities Other liabilitiesCommon stock Additional paid-in-capital Retained earningsCommon stock held in treasury Accumulated other comprehensive income (loss) Equity attributable to ITW stockholders Noncontrolling interest
| Answer 6
| |
| #2 | Answer 7 Choose the correct account Cash and equivalents Trade receivablesInventories Prepaid expenses and other current assets Assets held for sale Net plant and equipment GoodwillIntangible assets Deferred income taxes - asset Other assets Short-term debt Accounts payable Current portion of operating lease liabilities Accrued expenses Cash dividends payable Income taxes payable Liabilities held for sale Long-term debt Deferred income taxes - liabilities Noncurrent income taxes payable Long-term portion of operating lease liabilities Other liabilities Common stock Additional paid-in-capital Retained earnings Common stock held in treasury Accumulated other comprehensive income (loss) Equity attributable to ITW stockholders Noncontrolling interest
| Answer 8
|
(b) What is the company's largest liability in 2022 and its percentage of the total assets? Note: Round to the nearest whole percentage point; for example, enter 60 for 60.4% or 61 for 60.5%.
| Parker Hannifin | ||
|---|---|---|
Answer 9 Choose the correct account Cash and cash equivalents Marketable securities and other investments Trade accounts receivable, net Non-trade and notes receivableInventories Prepaid expenses and other Property, plant and equipment, net Deferred income taxes - assetInvestments and other assets Intangible assets, net Goodwill Notes payable and long-term debt payable within one year Accounts payable, trade Accrued payrolls and other compensation Accrued domestic and foreign taxes Current operating lease liabilities Other accrued liabilities Long-term debt Pensions and other postretirement benefits Deferred income taxes - liabilities Long-term operating lease liabilities Other liabilities Serial preferred stock Common stock Additional capital Retained earnings Accumulated other comprehensive (loss)Treasury stock Noncontrolling interests
| Answer 10
|
| Illinois Tool Works | ||
|---|---|---|
Answer 11 Choose the correct account Cash and equivalentsTrade receivablesInventories Prepaid expenses and other current assets Assets held for sale Net plant and equipment GoodwillIntangible assets Deferred income taxes - asset Other assetsShort-term debt Accounts payable Current portion of operating lease liabilities Accrued expenses Cash dividends payable Income taxes payable Liabilities held for sale Long-term debt Deferred income taxes - liabilities Noncurrent income taxes payable Long-term portion of operating lease liabilities Other liabilities Common stock Additional paid-in-capital Retained earnings Common stock held in treasury Accumulated other comprehensive income (loss) Equity attributable to ITW stockholders Noncontrolling interest
| Answer 12
|
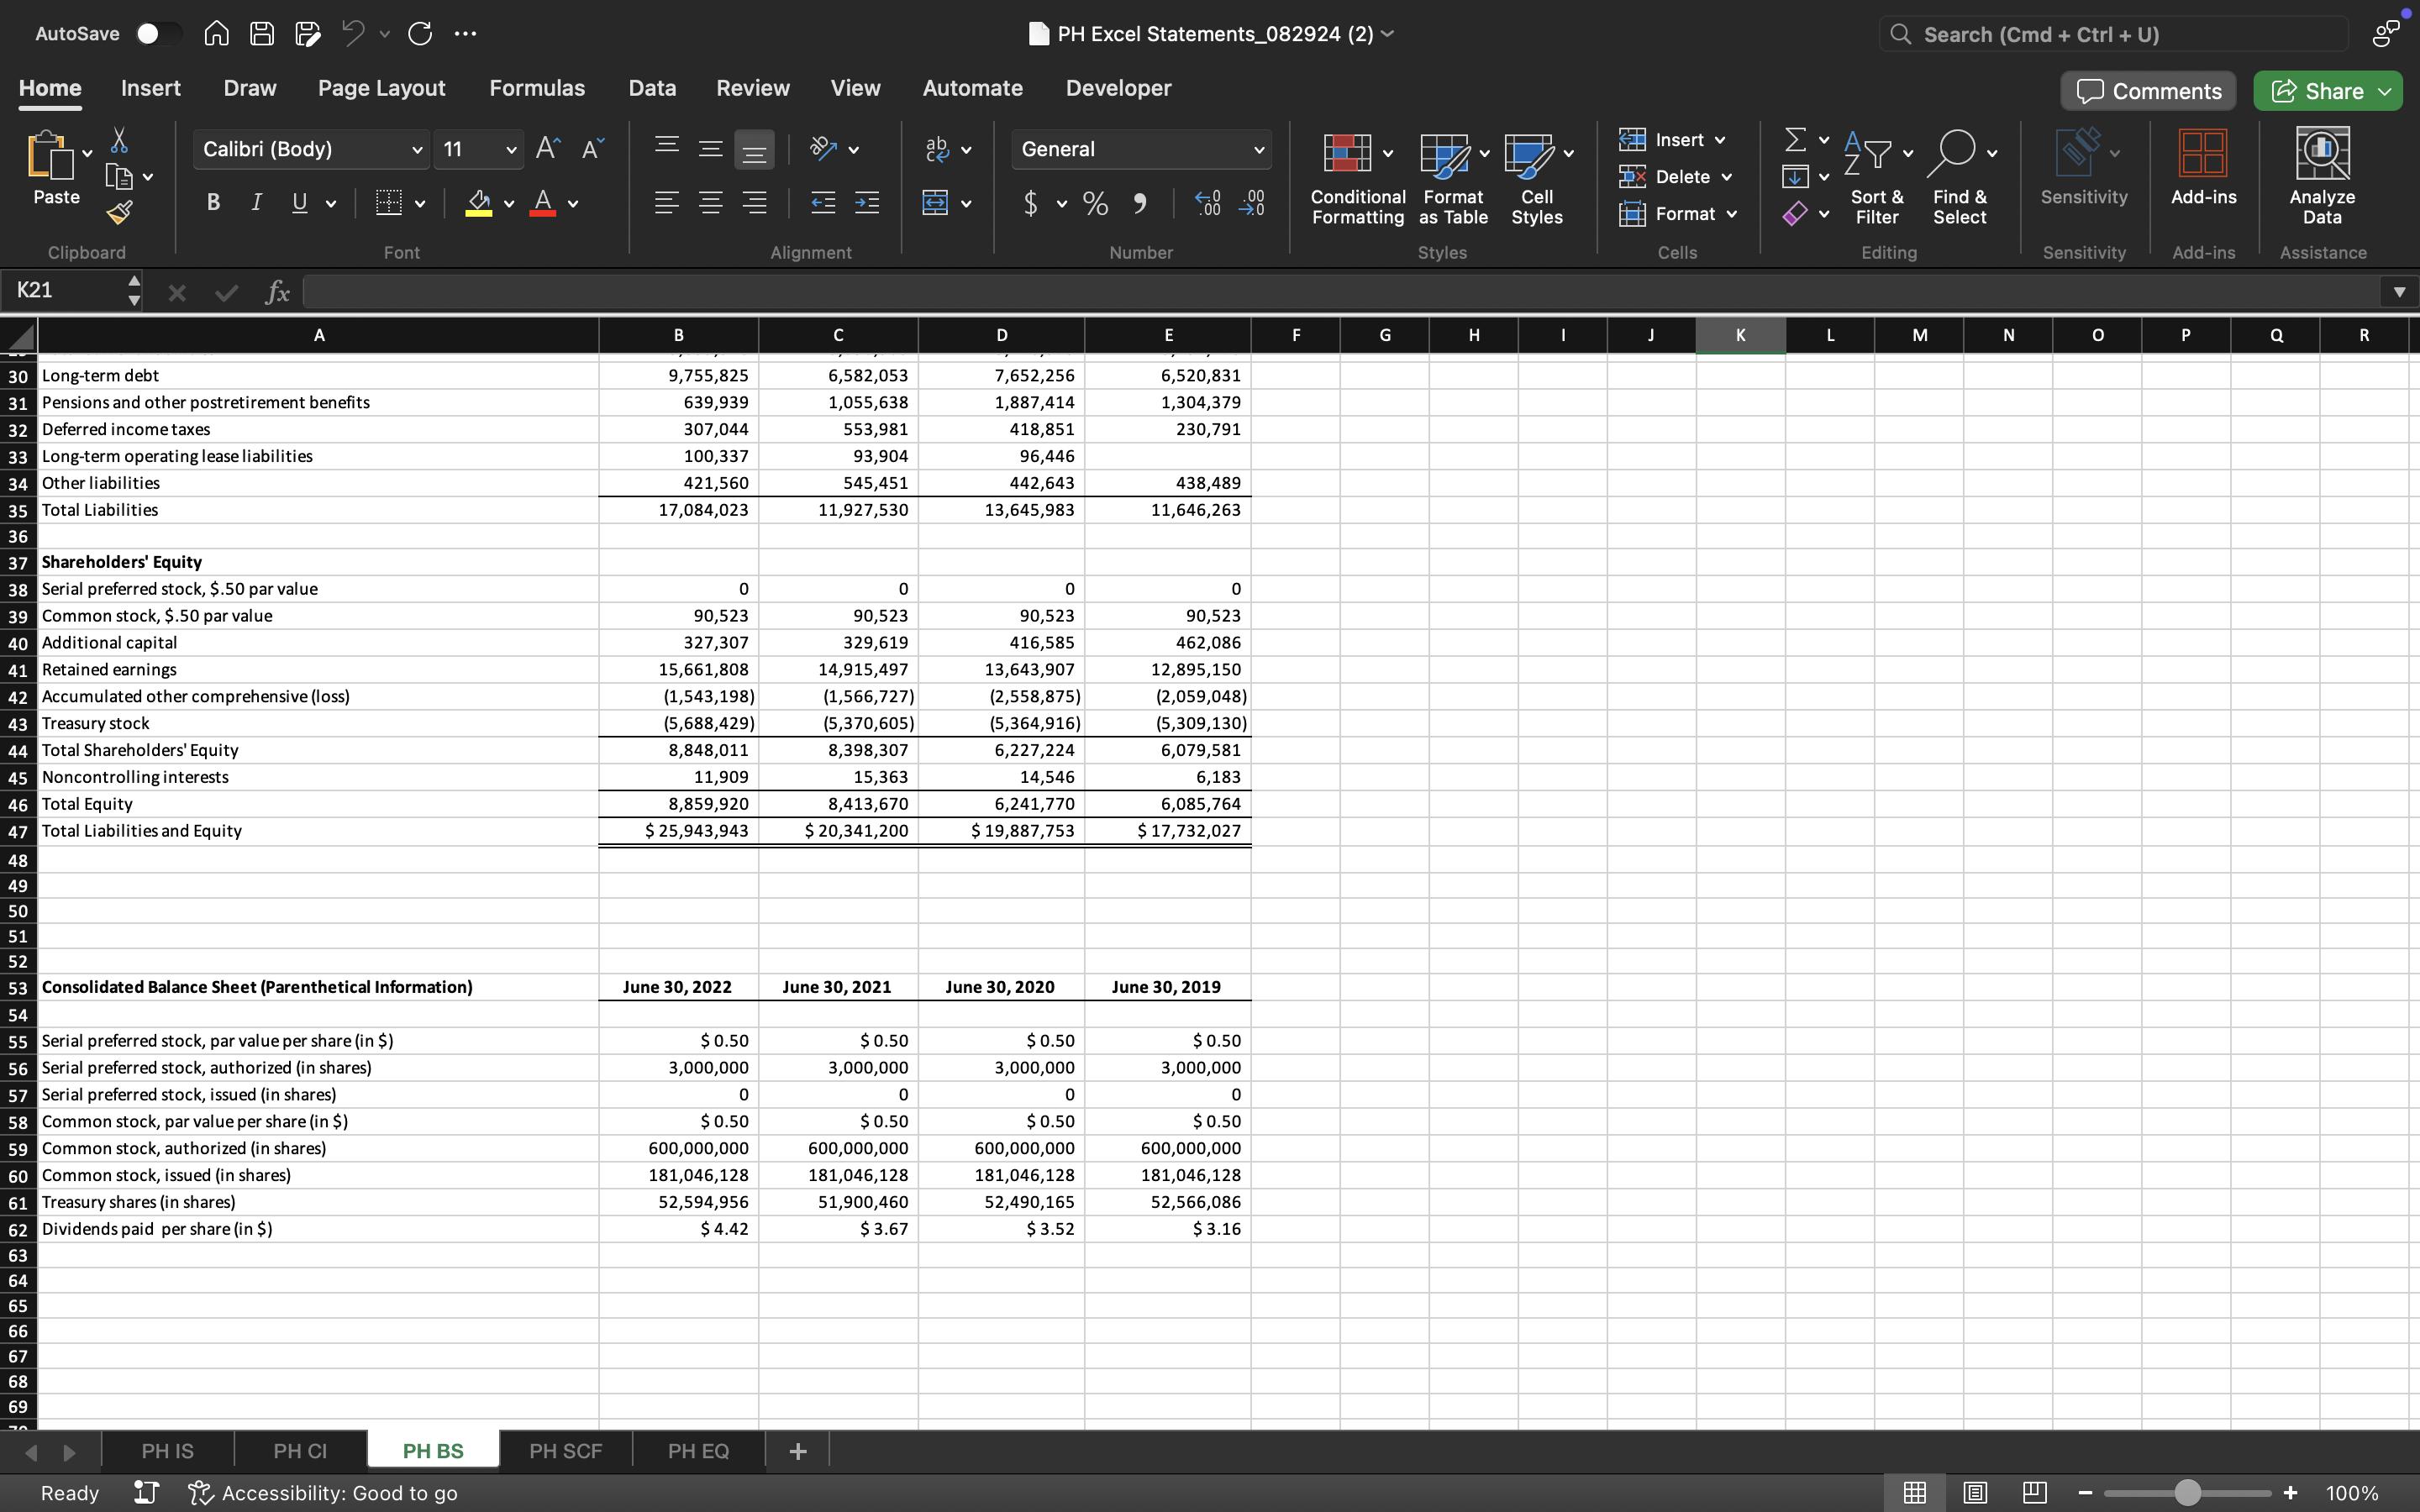
(c) What proportion of total assets is financed by owners in 2022? (Hint: Compare total equity to assets.) Note: Round to the nearest whole percentage point; for example, enter 60 for 60.4% or 61 for 60.5%.
| Parker Hannifin: | Answer 13
| |
| Illinois Tool Work: | Answer 14
|
(d) What proportion of total assets is financed by nonowners in 2022? Note: Round to the nearest whole percentage point; for example, enter 60 for 60.4% or 61 for 60.5%.
| Parker Hannifin: | Answer 15
| |
| Illinois Tool Work: | Answer 16
|
Question 2
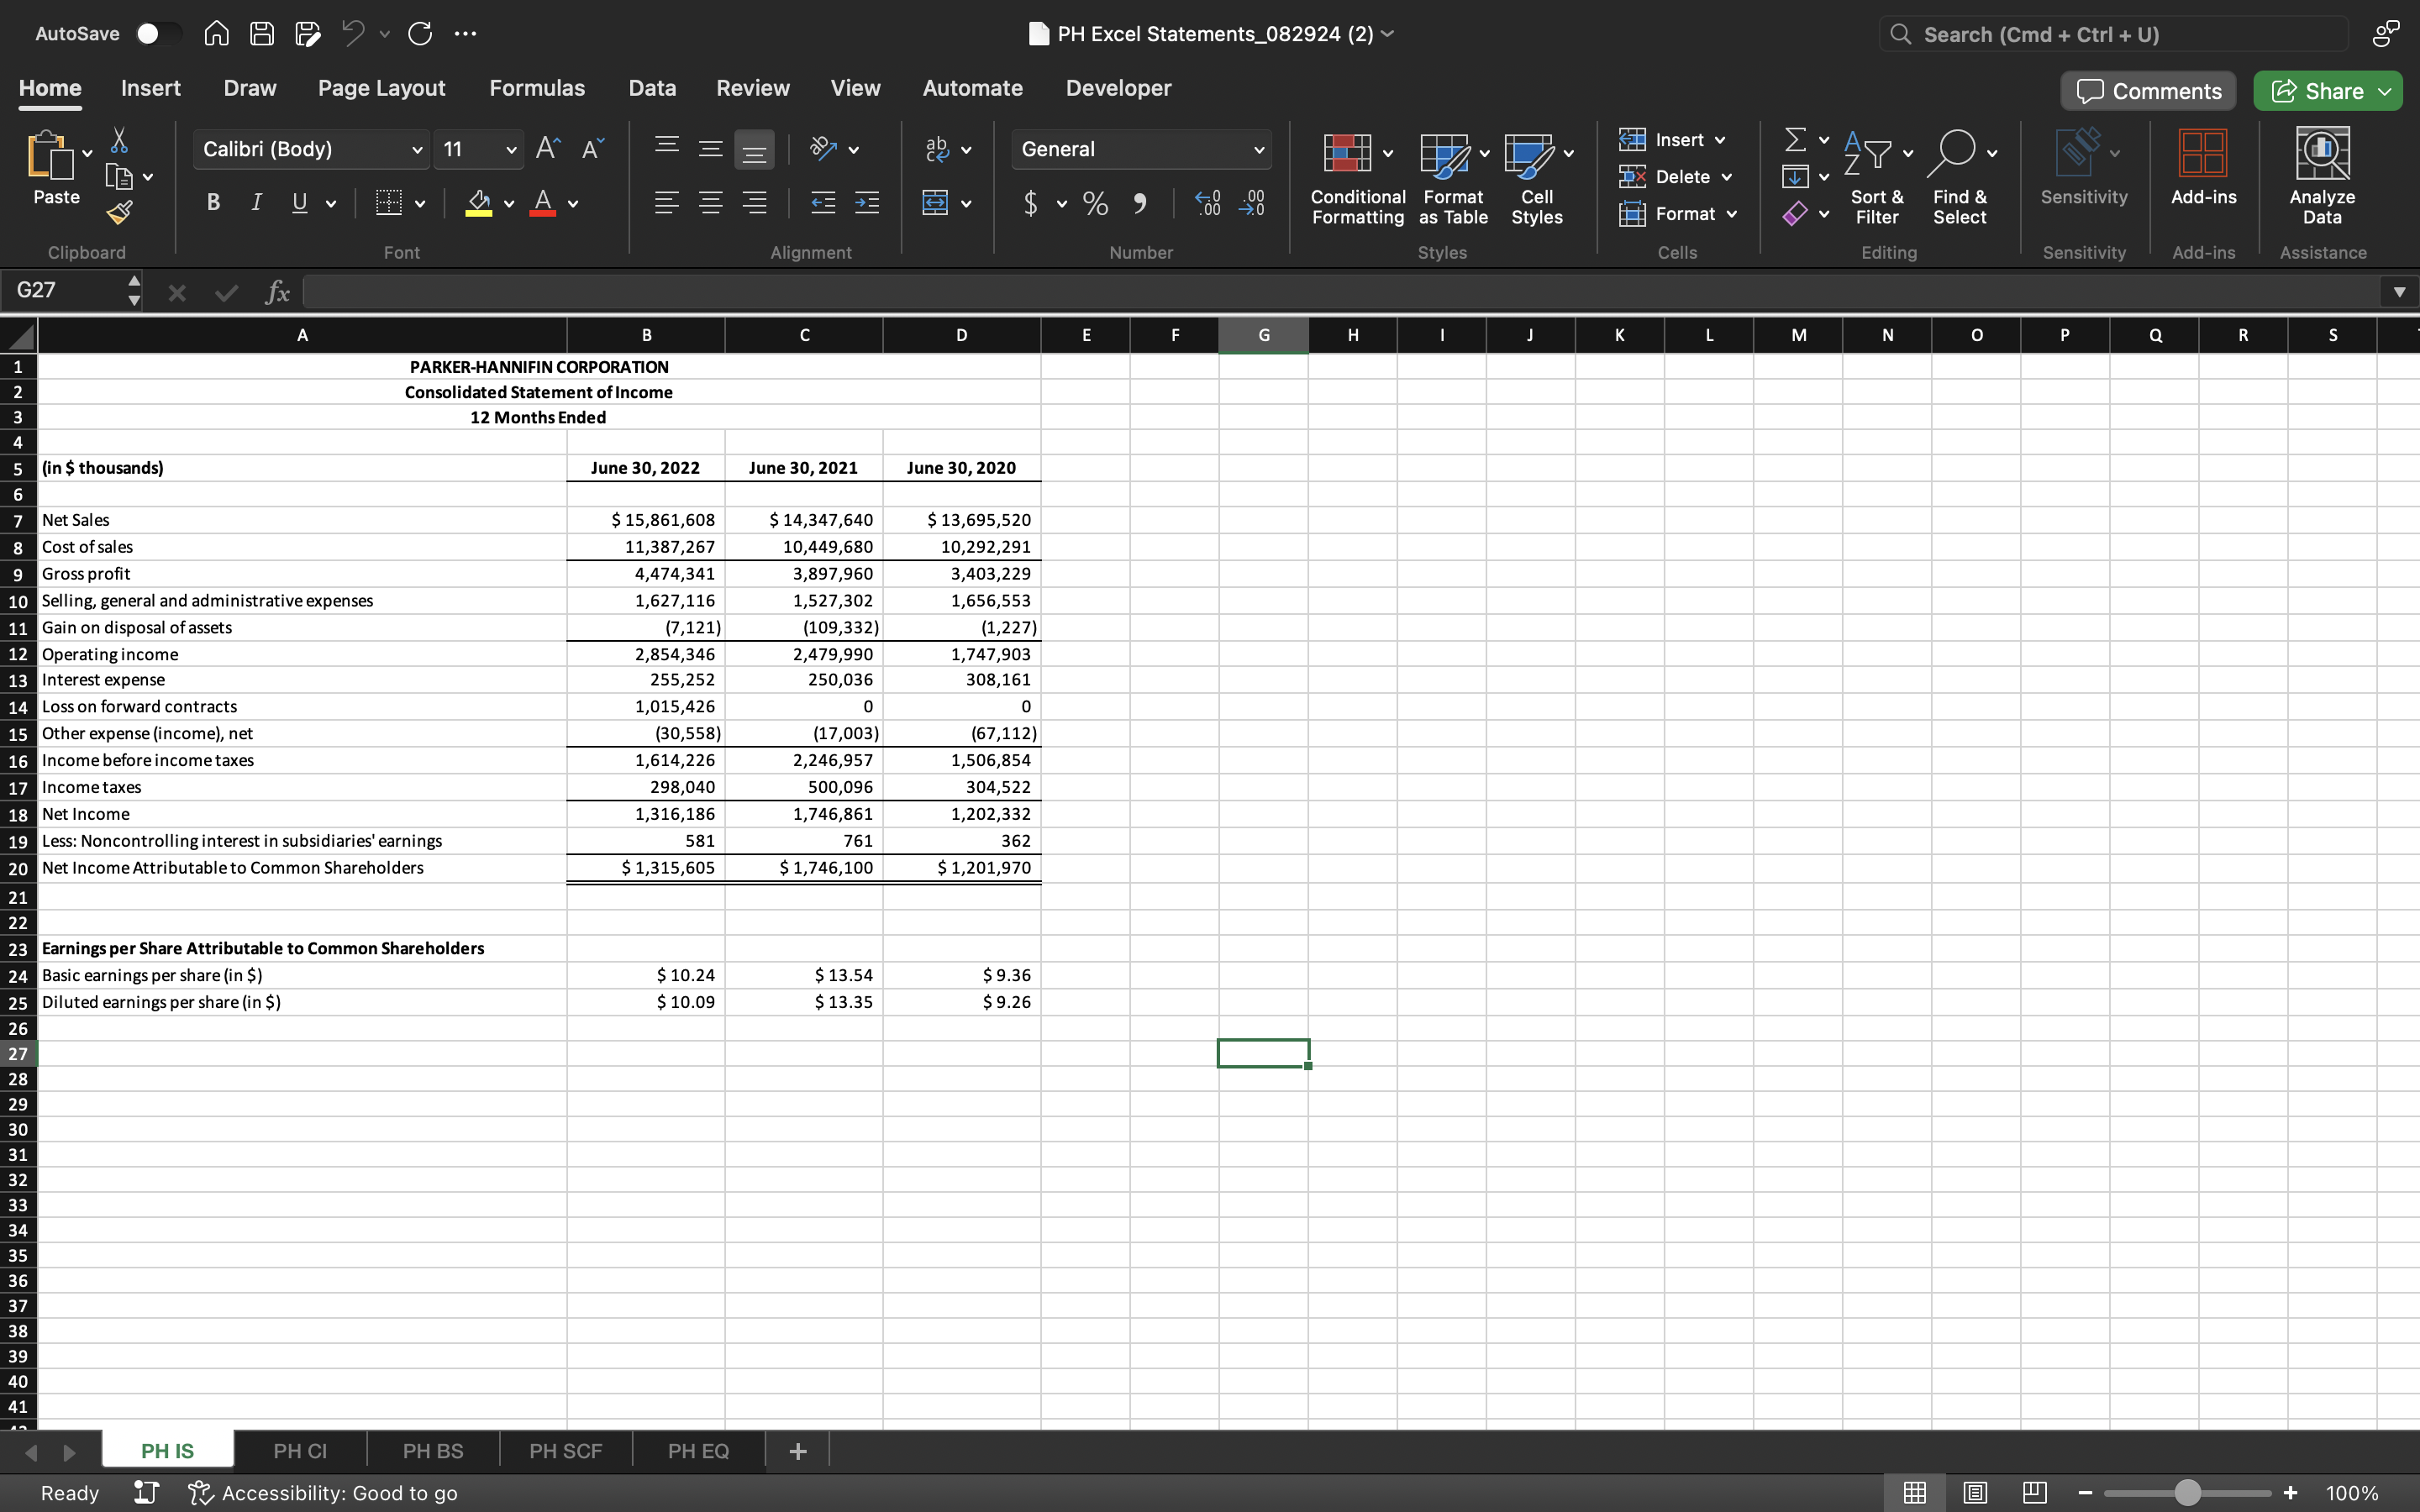
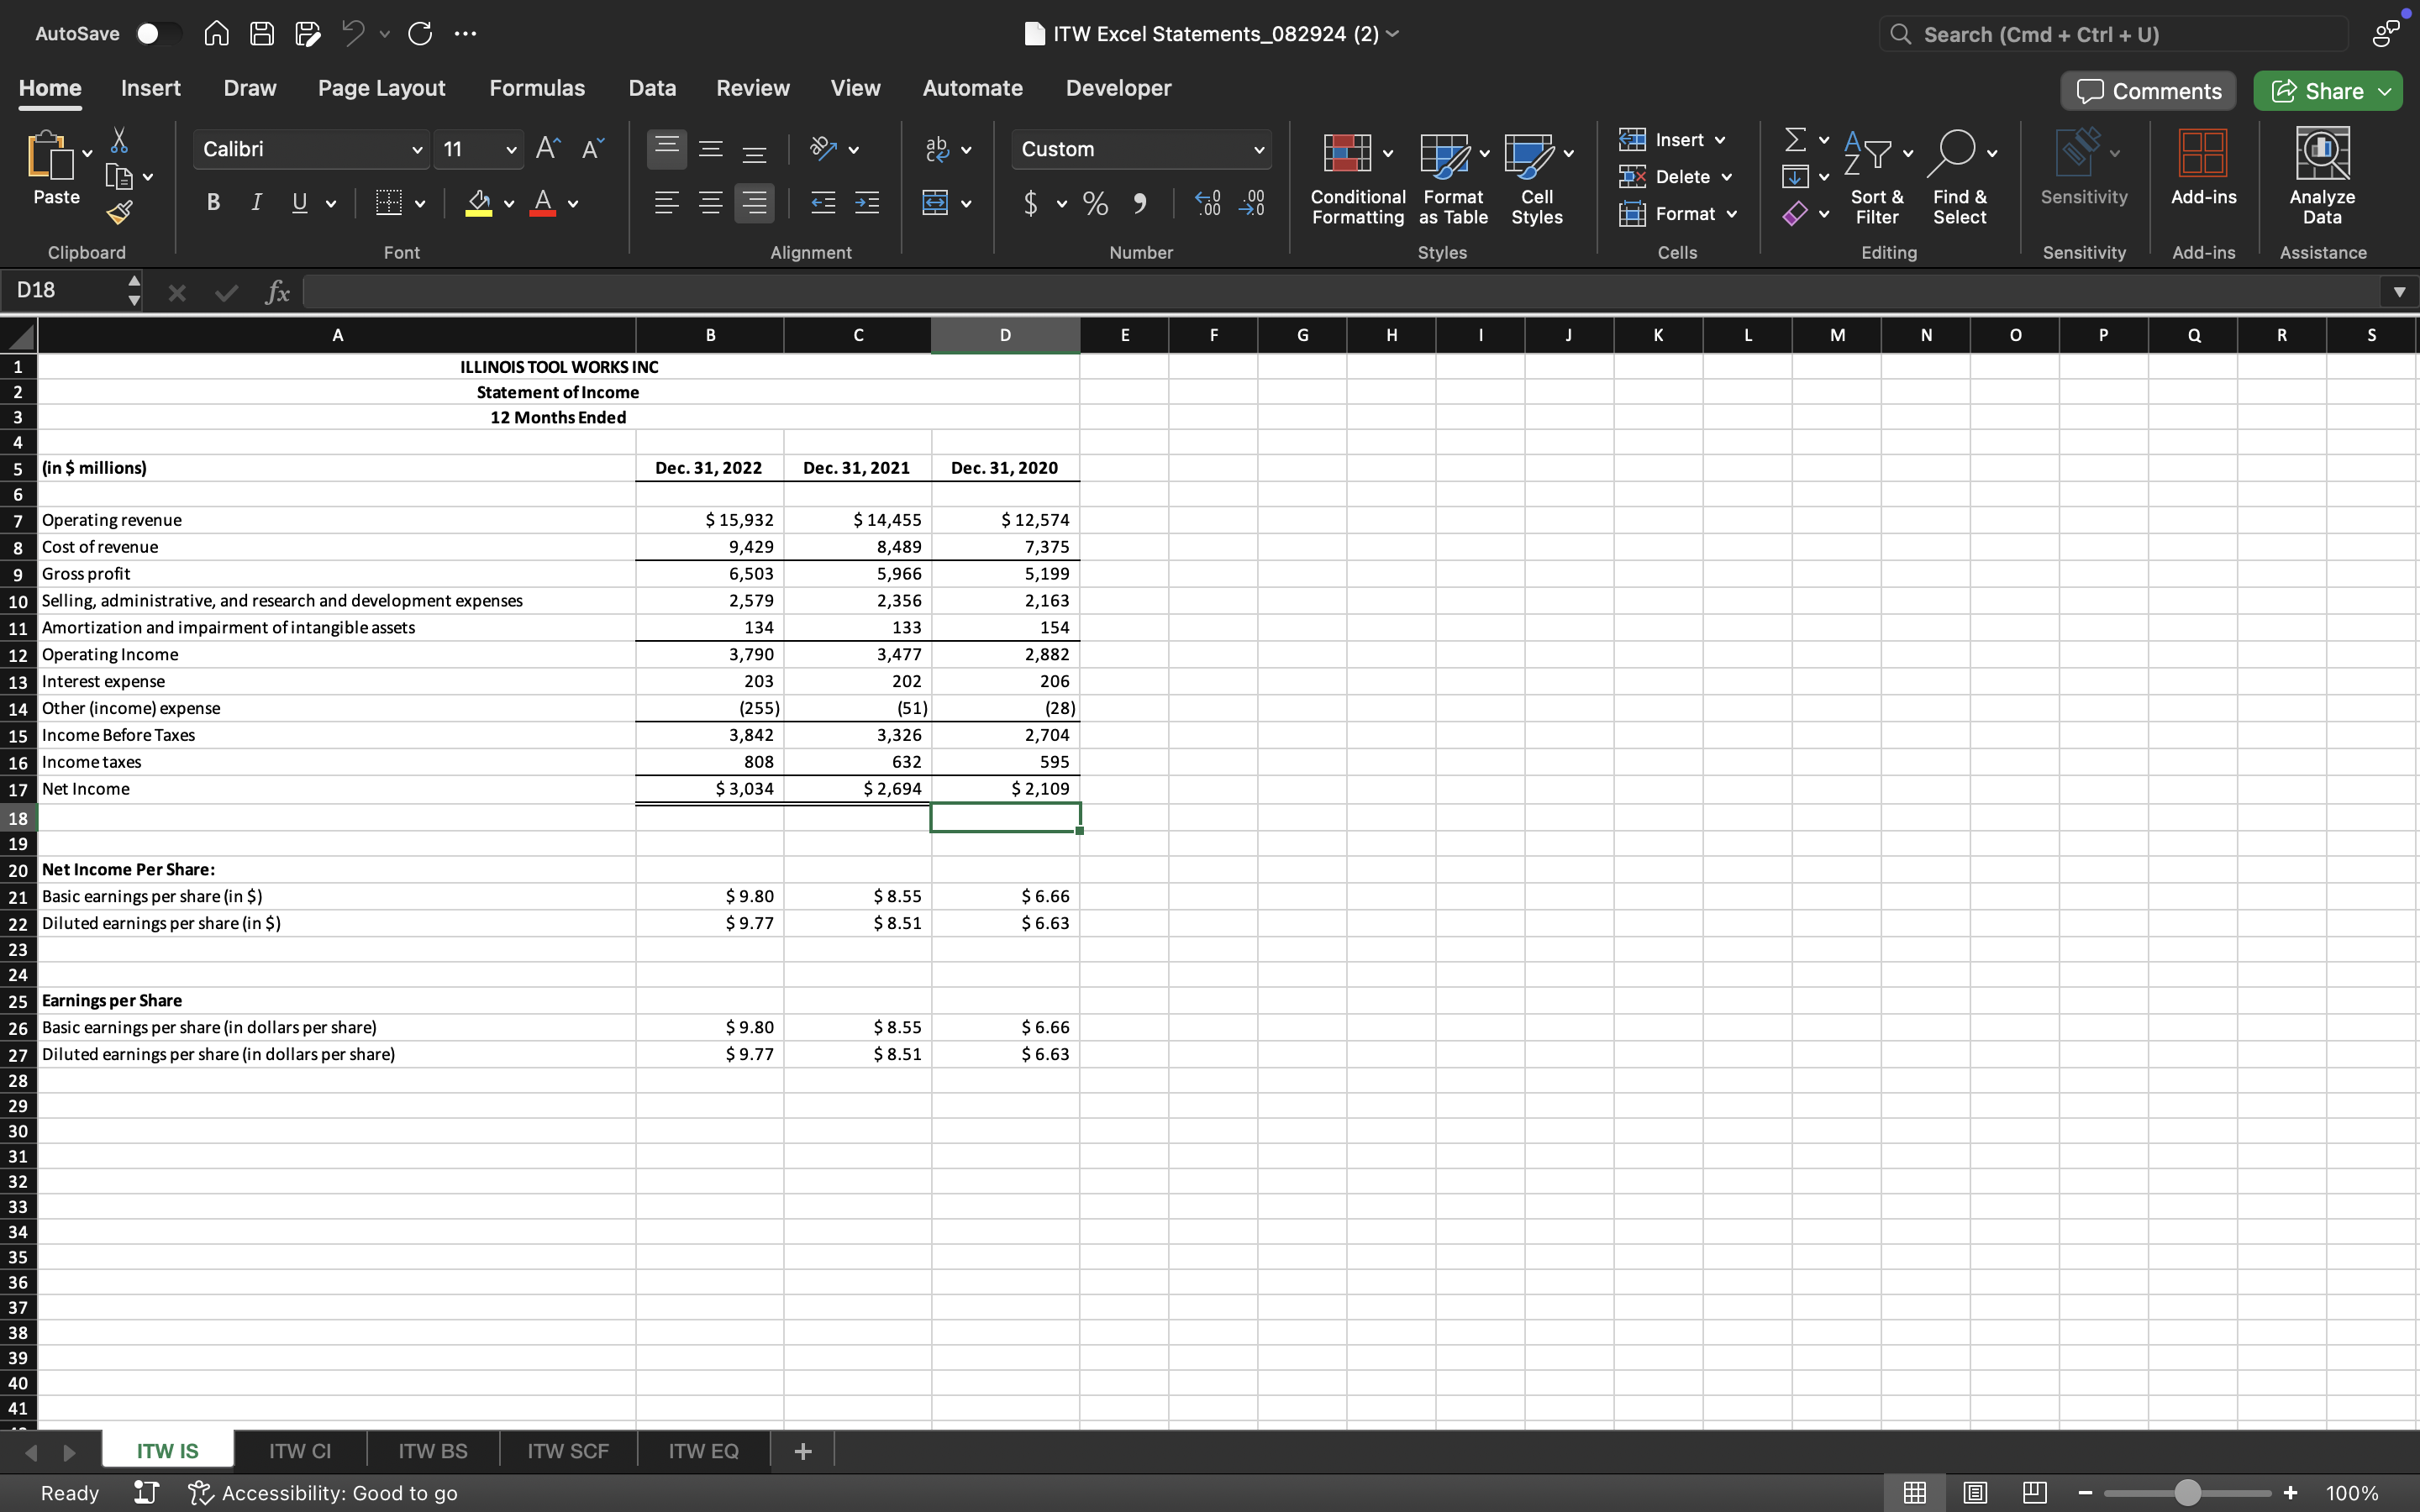
Income Statement Analysis Using the income statement tab in the Excel financial statements files, prepare a common-size income statement for each company. Express each item on the income statement as a percent of total sales or revenue. Do this for all years on the income statement. Look for major differences over time and between the companies. (a) What are the company's two largest expenses in 2022 ranked in order and their respective percentages of total sales? Note: Round to the nearest whole percentage point; for example, enter 60 for 60.4% or 61 for 60.5%.
| Ranking | Parker Hannifin | ||
|---|---|---|---|
| #1 | Answer 1Cost of salesSelling, general and administrative expensesGain on disposal of assetsInterest expenseLoss on forward contractsOther expense (income), netIncome taxes
| Answer 2
| |
| #2 | Answer 3Cost of salesSelling, general and administrative expensesGain on disposal of assetsInterest expenseLoss on forward contractsOther expense (income), netIncome taxes
| Answer 4
|
| Ranking | Illinois Tool Works | ||
|---|---|---|---|
| #1 | Answer 5 Choose the correct account Cost of revenue Selling, administrative, and research and development expenses Amortization and impairment of intangible assets Interest expense Other (income) expense Income taxes did not have any
| Answer 6
| |
| #2 | Answer 7 Choose the correct account Cost of revenue Selling, administrative, and research and development expenses Amortization and impairment of intangible assets Interest expense Other (income) expense Income taxes did not have any
| Answer 8
|
(b) Are there any unusual or discontinued items in 2022? If there are multiple items, please identify the largest one in magnitude.
| Parker Hannifin: | Answer 9 Choose the correct answer Yes, cost of sales is an unusual or discontinued item. Yes, selling, general and administrative expenses is an unusual or discontinued item. Yes, gain on disposal of assets is an unusual or discontinued item. Yes, interest expense is an unusual or discontinued item. Yes, loss on forward contracts is an unusual or discontinued item. Yes, other expense (income), net is an unusual or discontinued item. No, did not have any unusual or discontinued item.
|
| Illinois Tool Works: | Answer 10 Choose the correct answer Yes, cost of revenue is an unusual or discontinued item. Yes, selling, administrative, and research and development expenses is an unusual or discontinued item. Yes, amortization and impairment of intangible assets is an unusual or discontinued item. Yes, interest expense is an unusual or discontinued item. Yes, other (income) expense is an unusual or discontinued item. Yes, income taxes is an unusual or discontinued item. No, did not have any unusual or discontinued item.
|
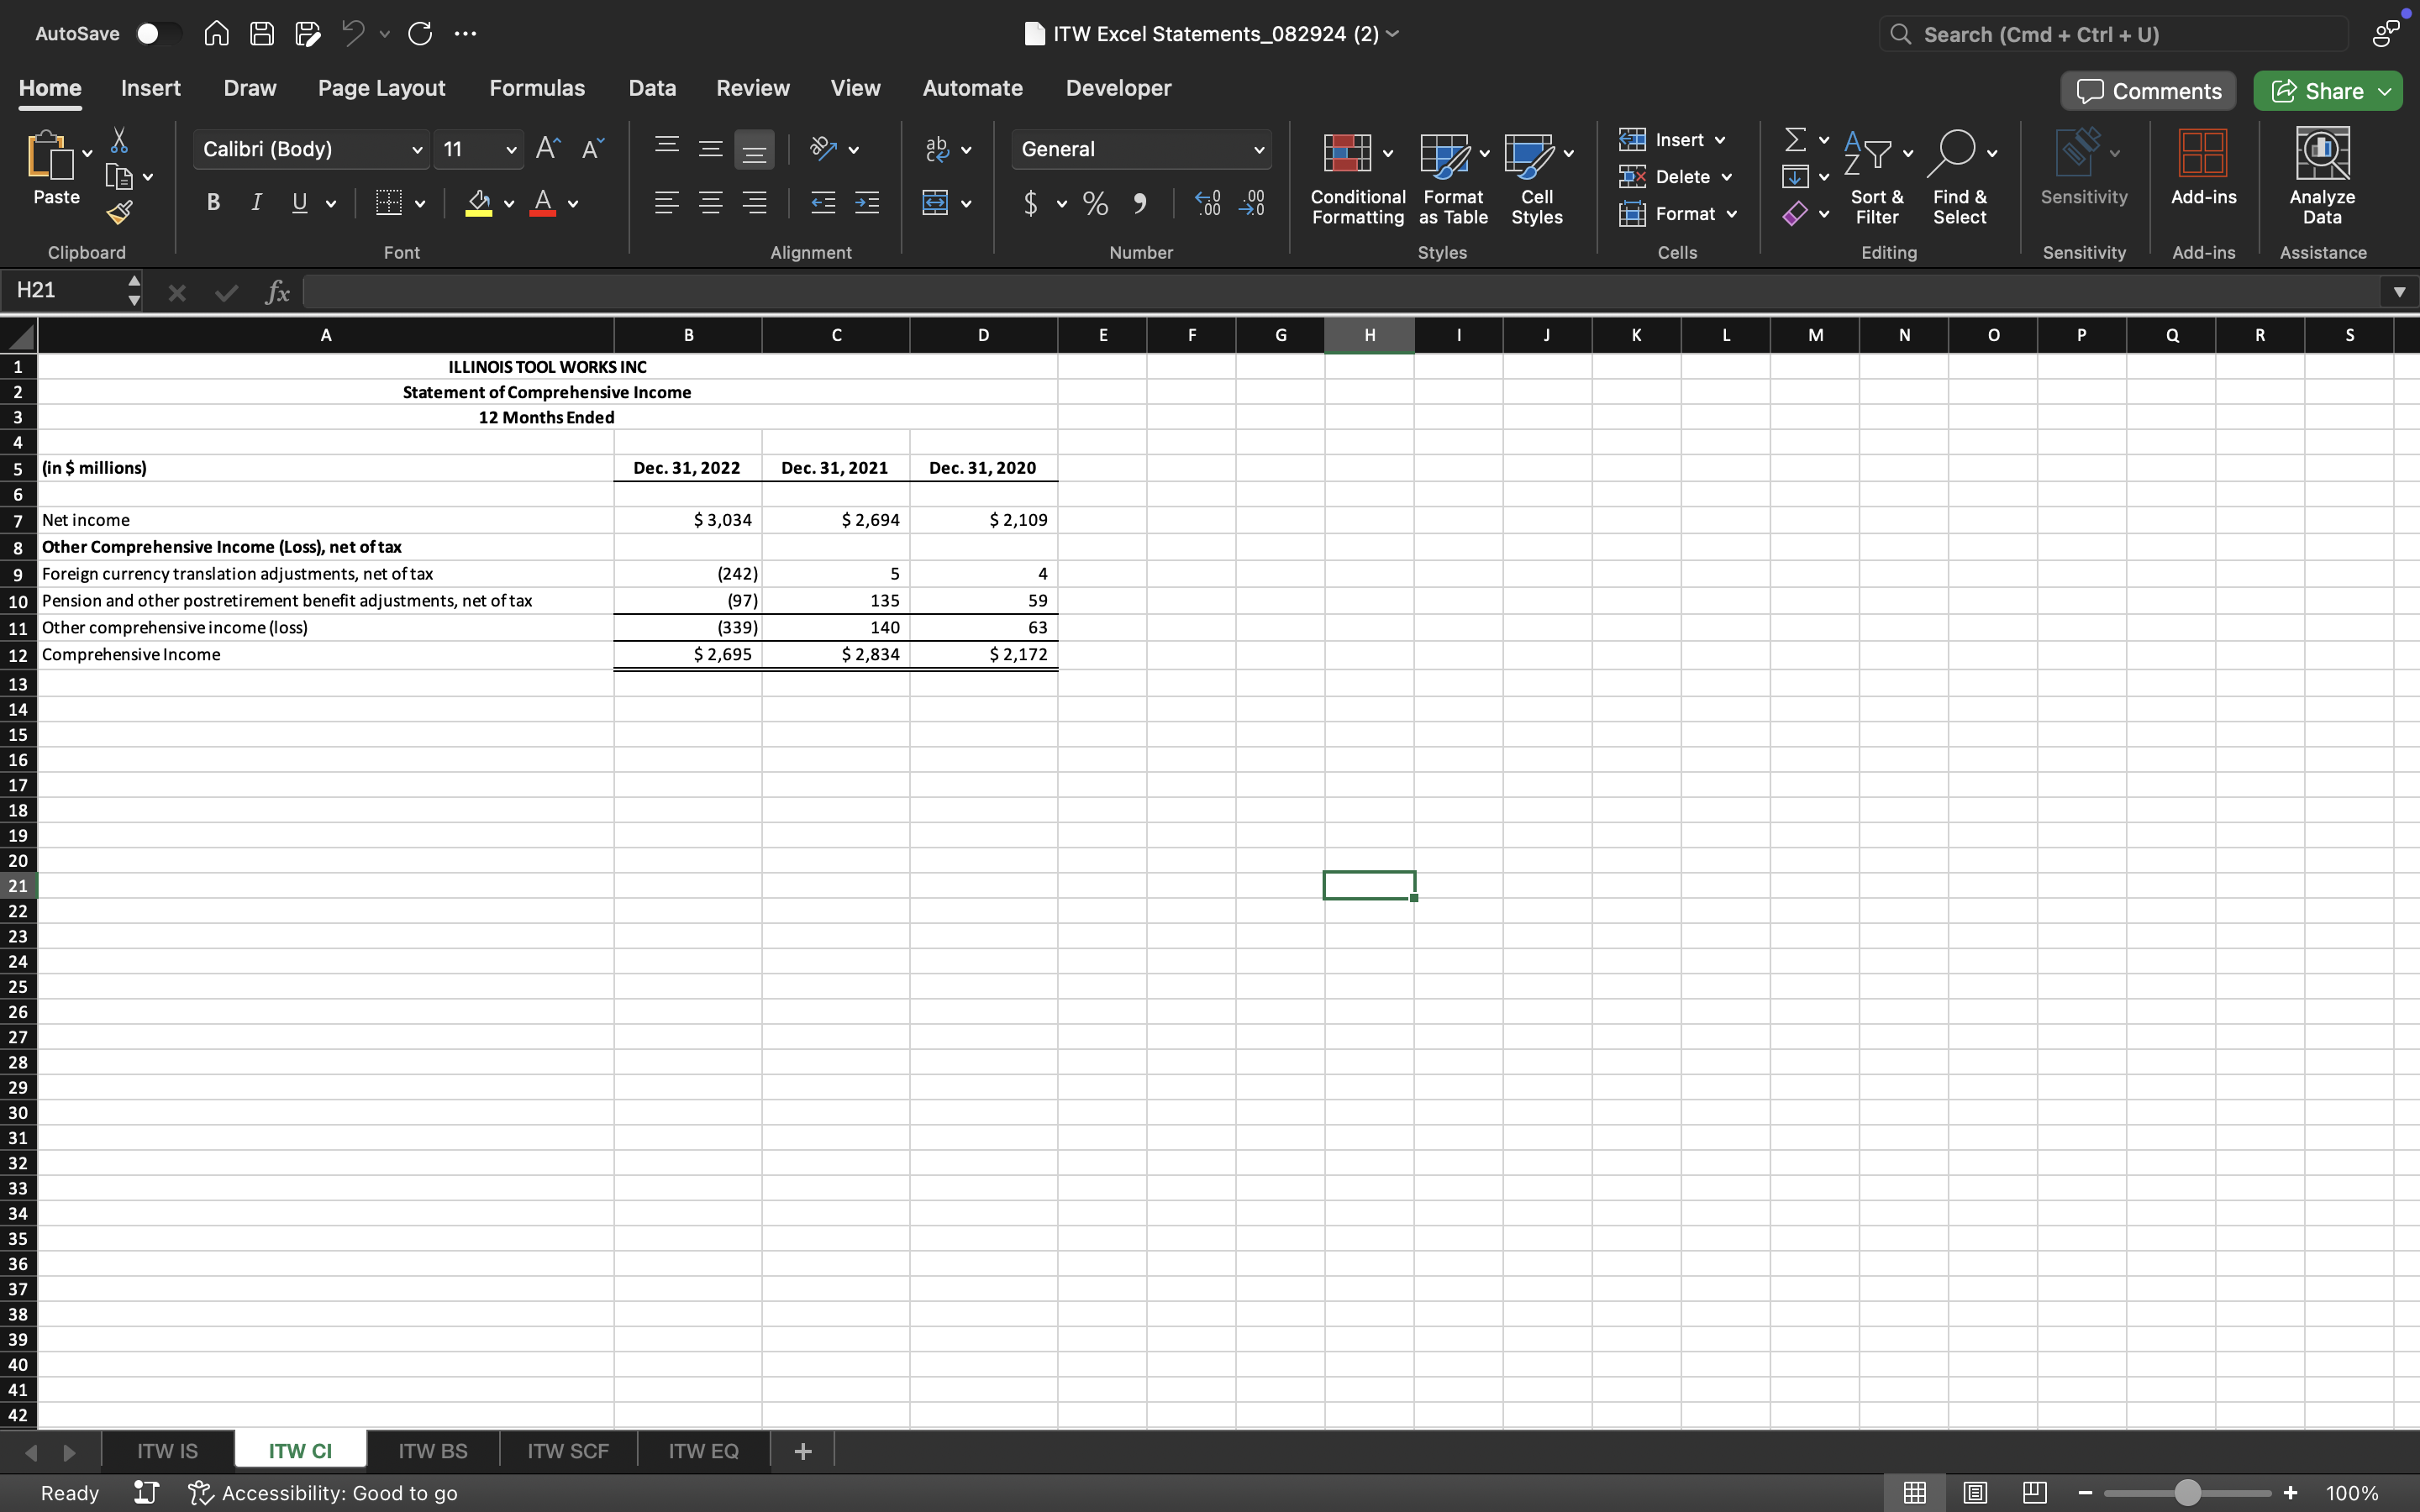
(c) Was the company more or less profitable (as a % of sales) when compared with the prior year? Note: Enter the percent rounded to one digit after the decimal; for example, enter 8.4 for 8.44%, or 8.5 for 8.45%.
In 2022, Parker Hannifin was Answer 11 more/less profitable than it was in 2021. Net income was Answer 12 % and Answer 13 % of revenue in those years respectively.
In 2022, Illinois Tool Works was Answer 14 more/less profitable than it was in 2021. Net income was Answer 15 % and Answer 16 % of revenue in those years respectively.
Question 3
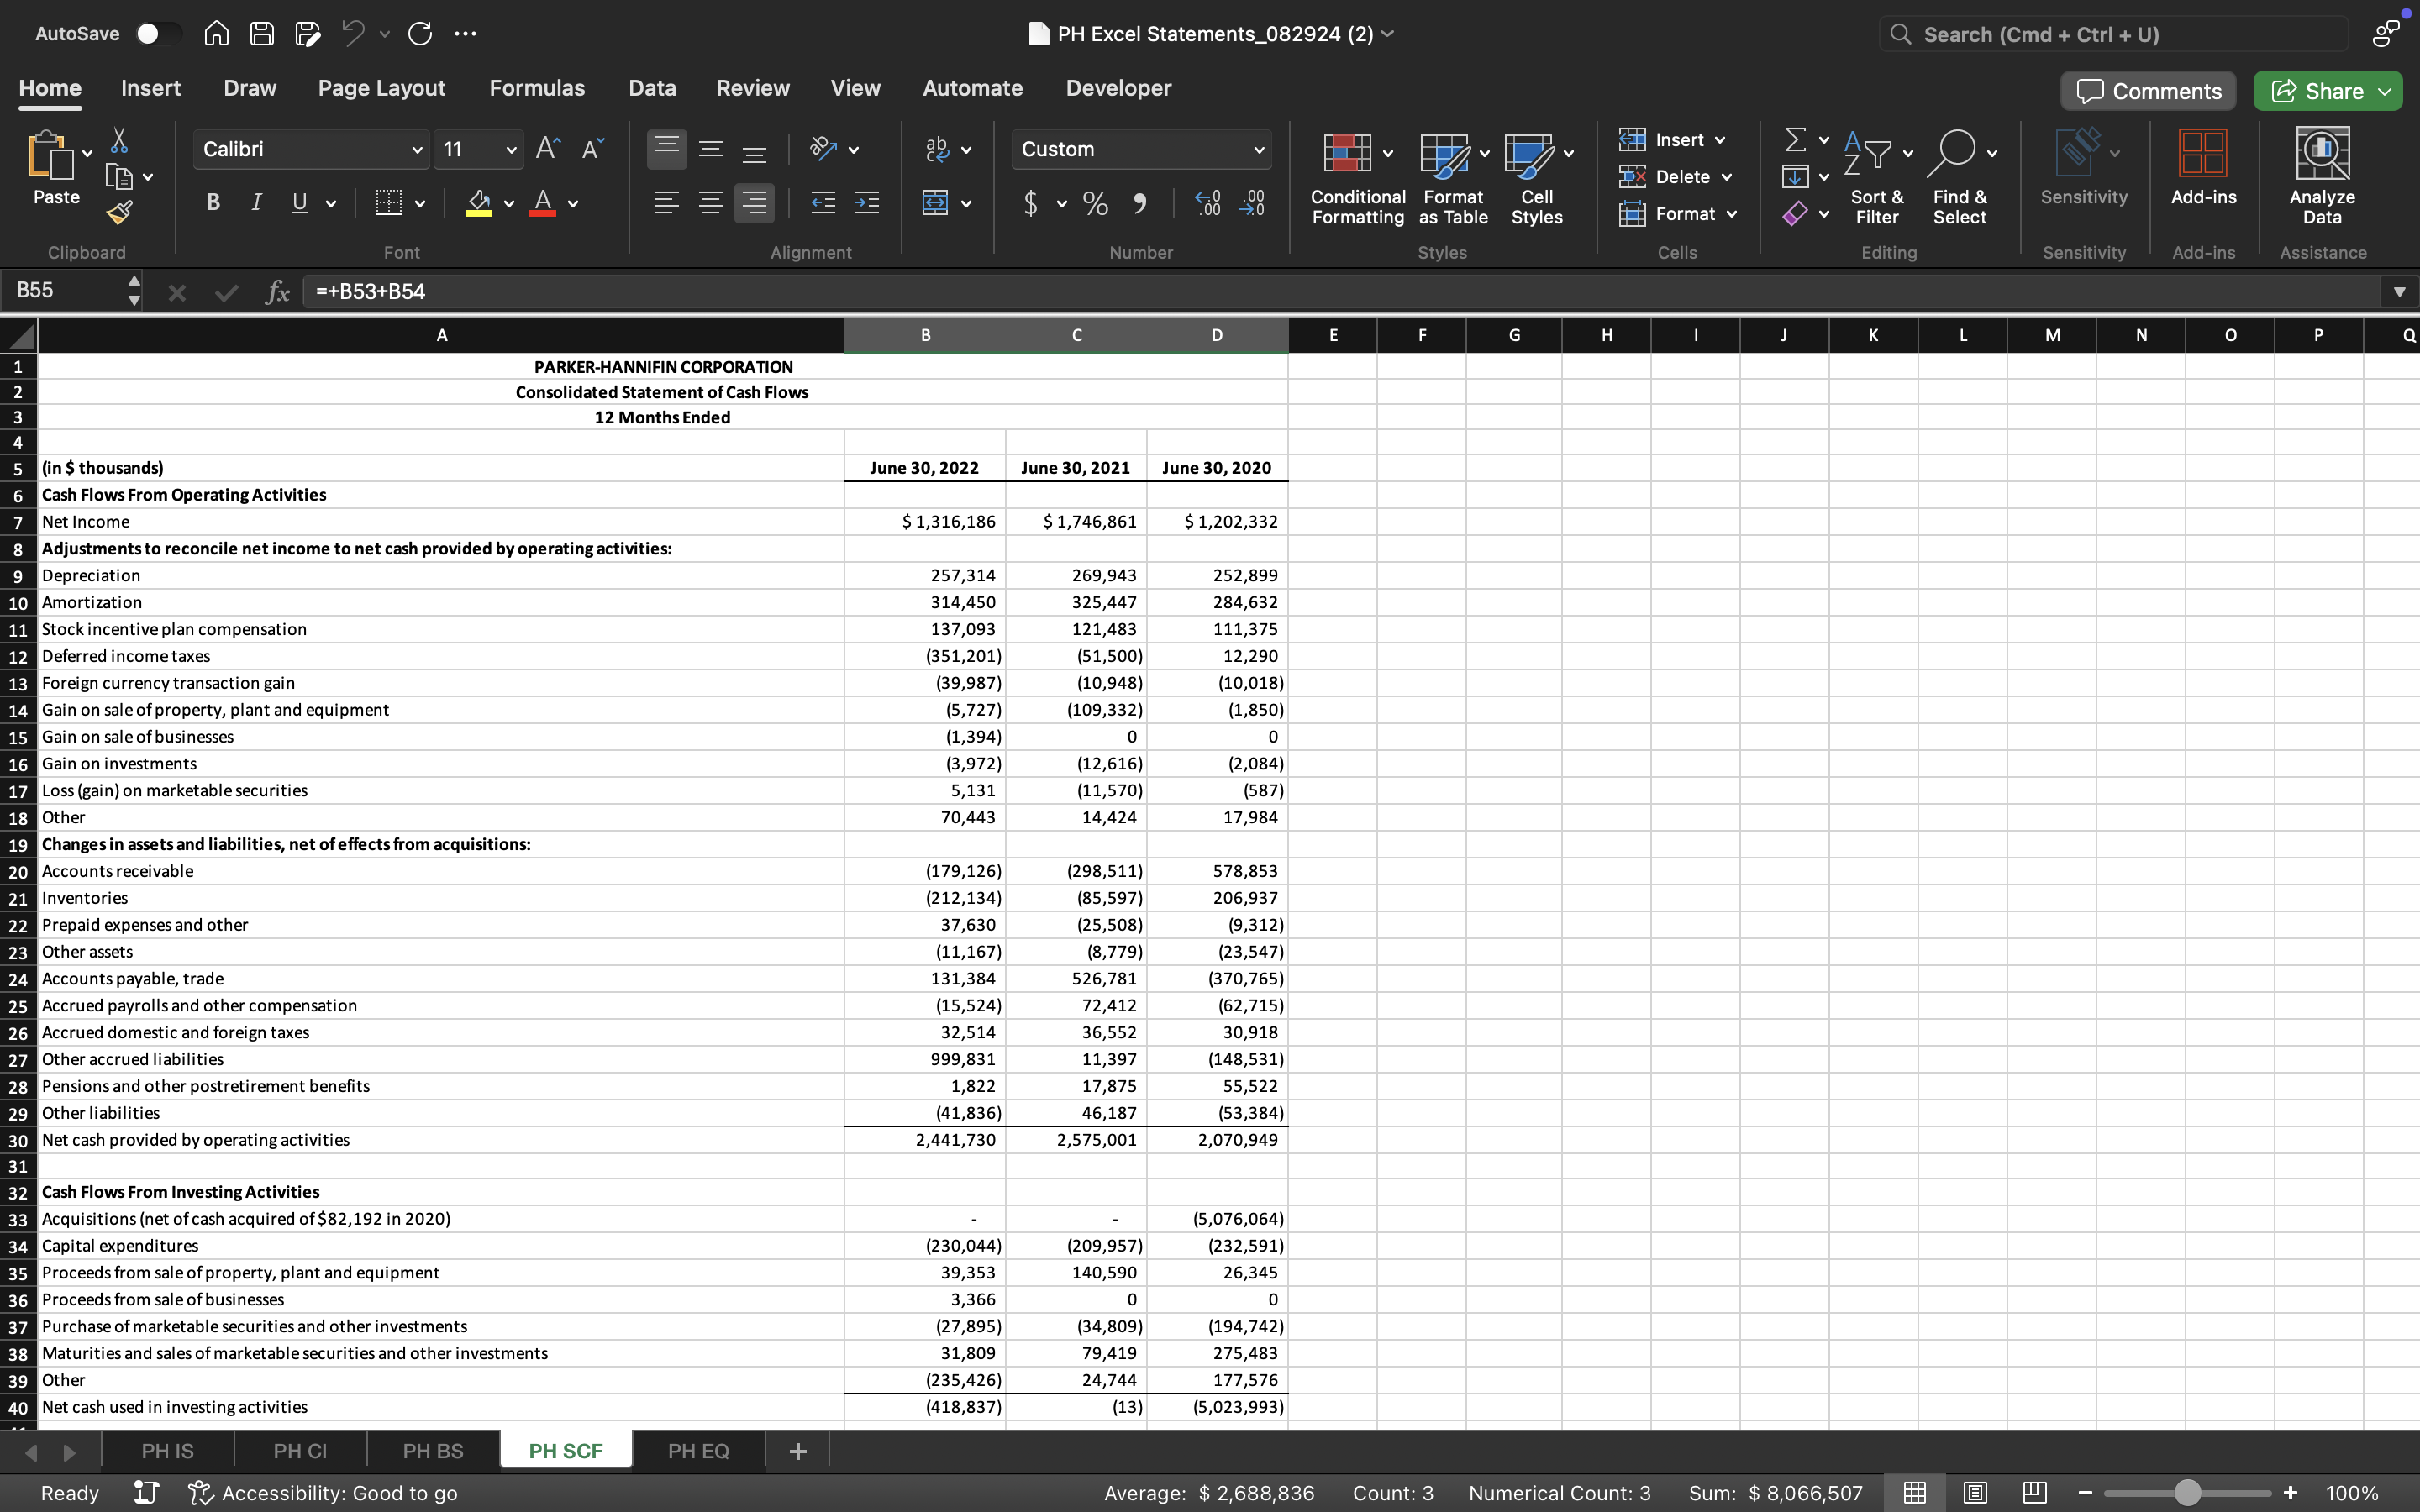
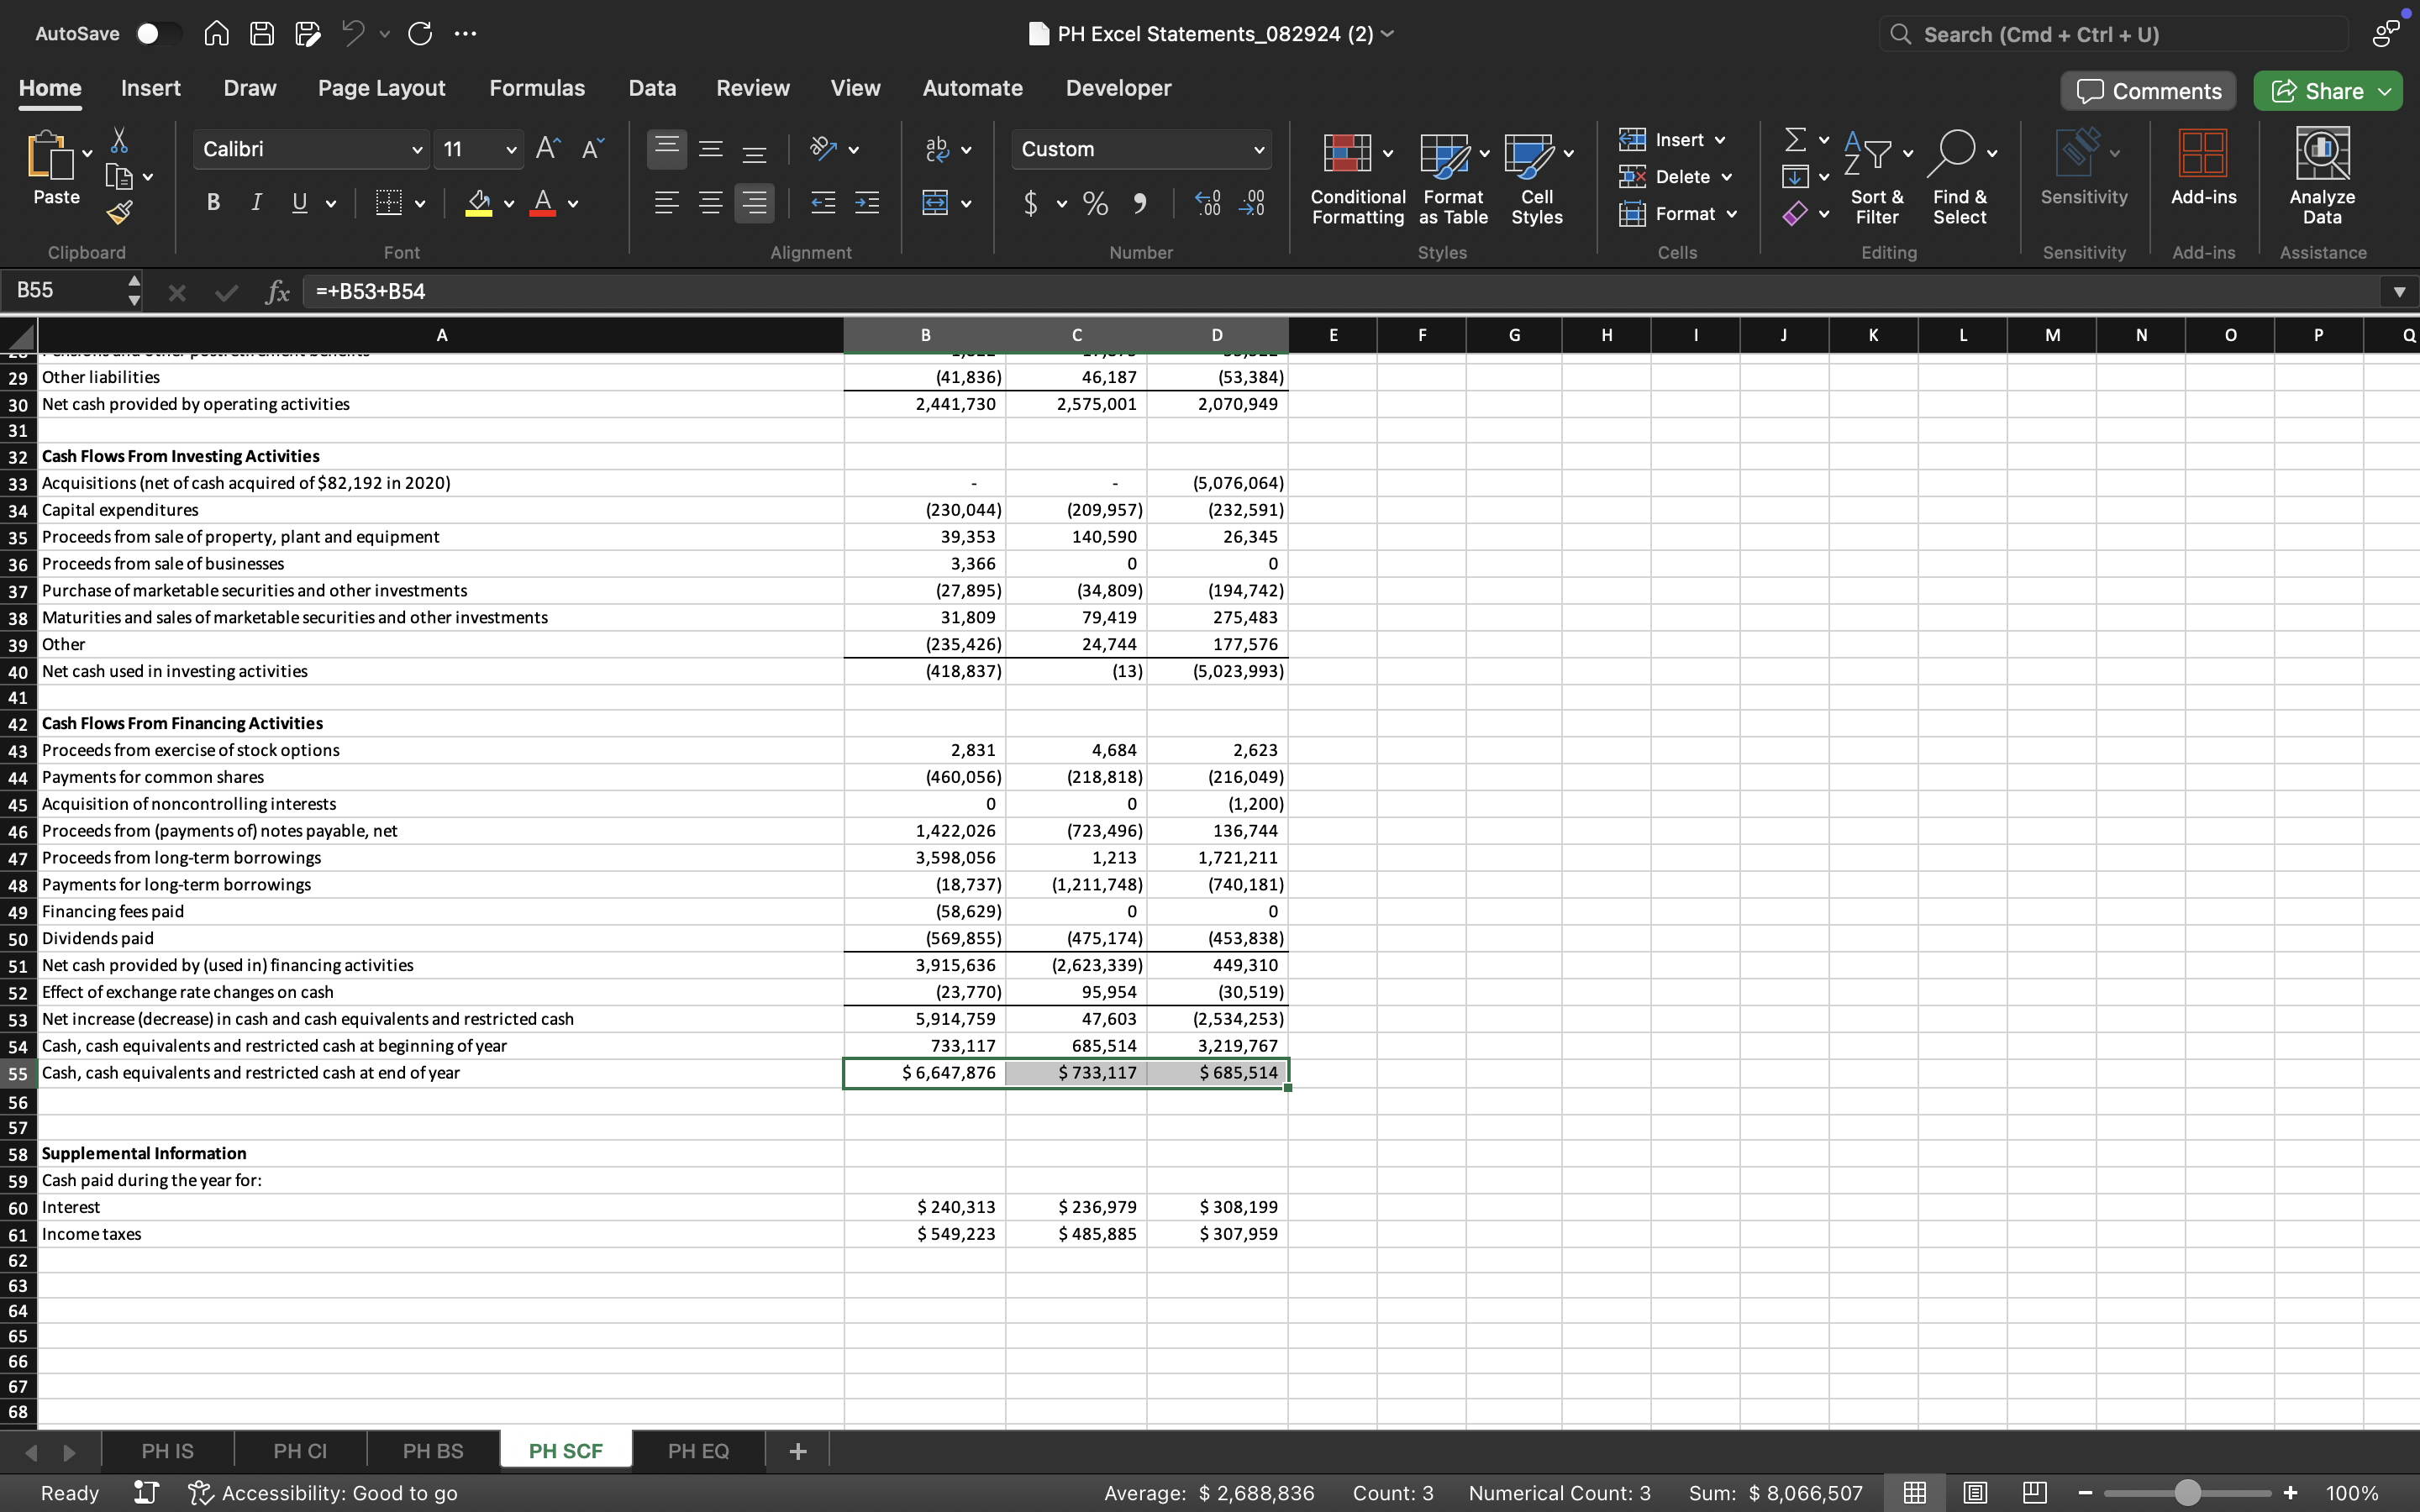
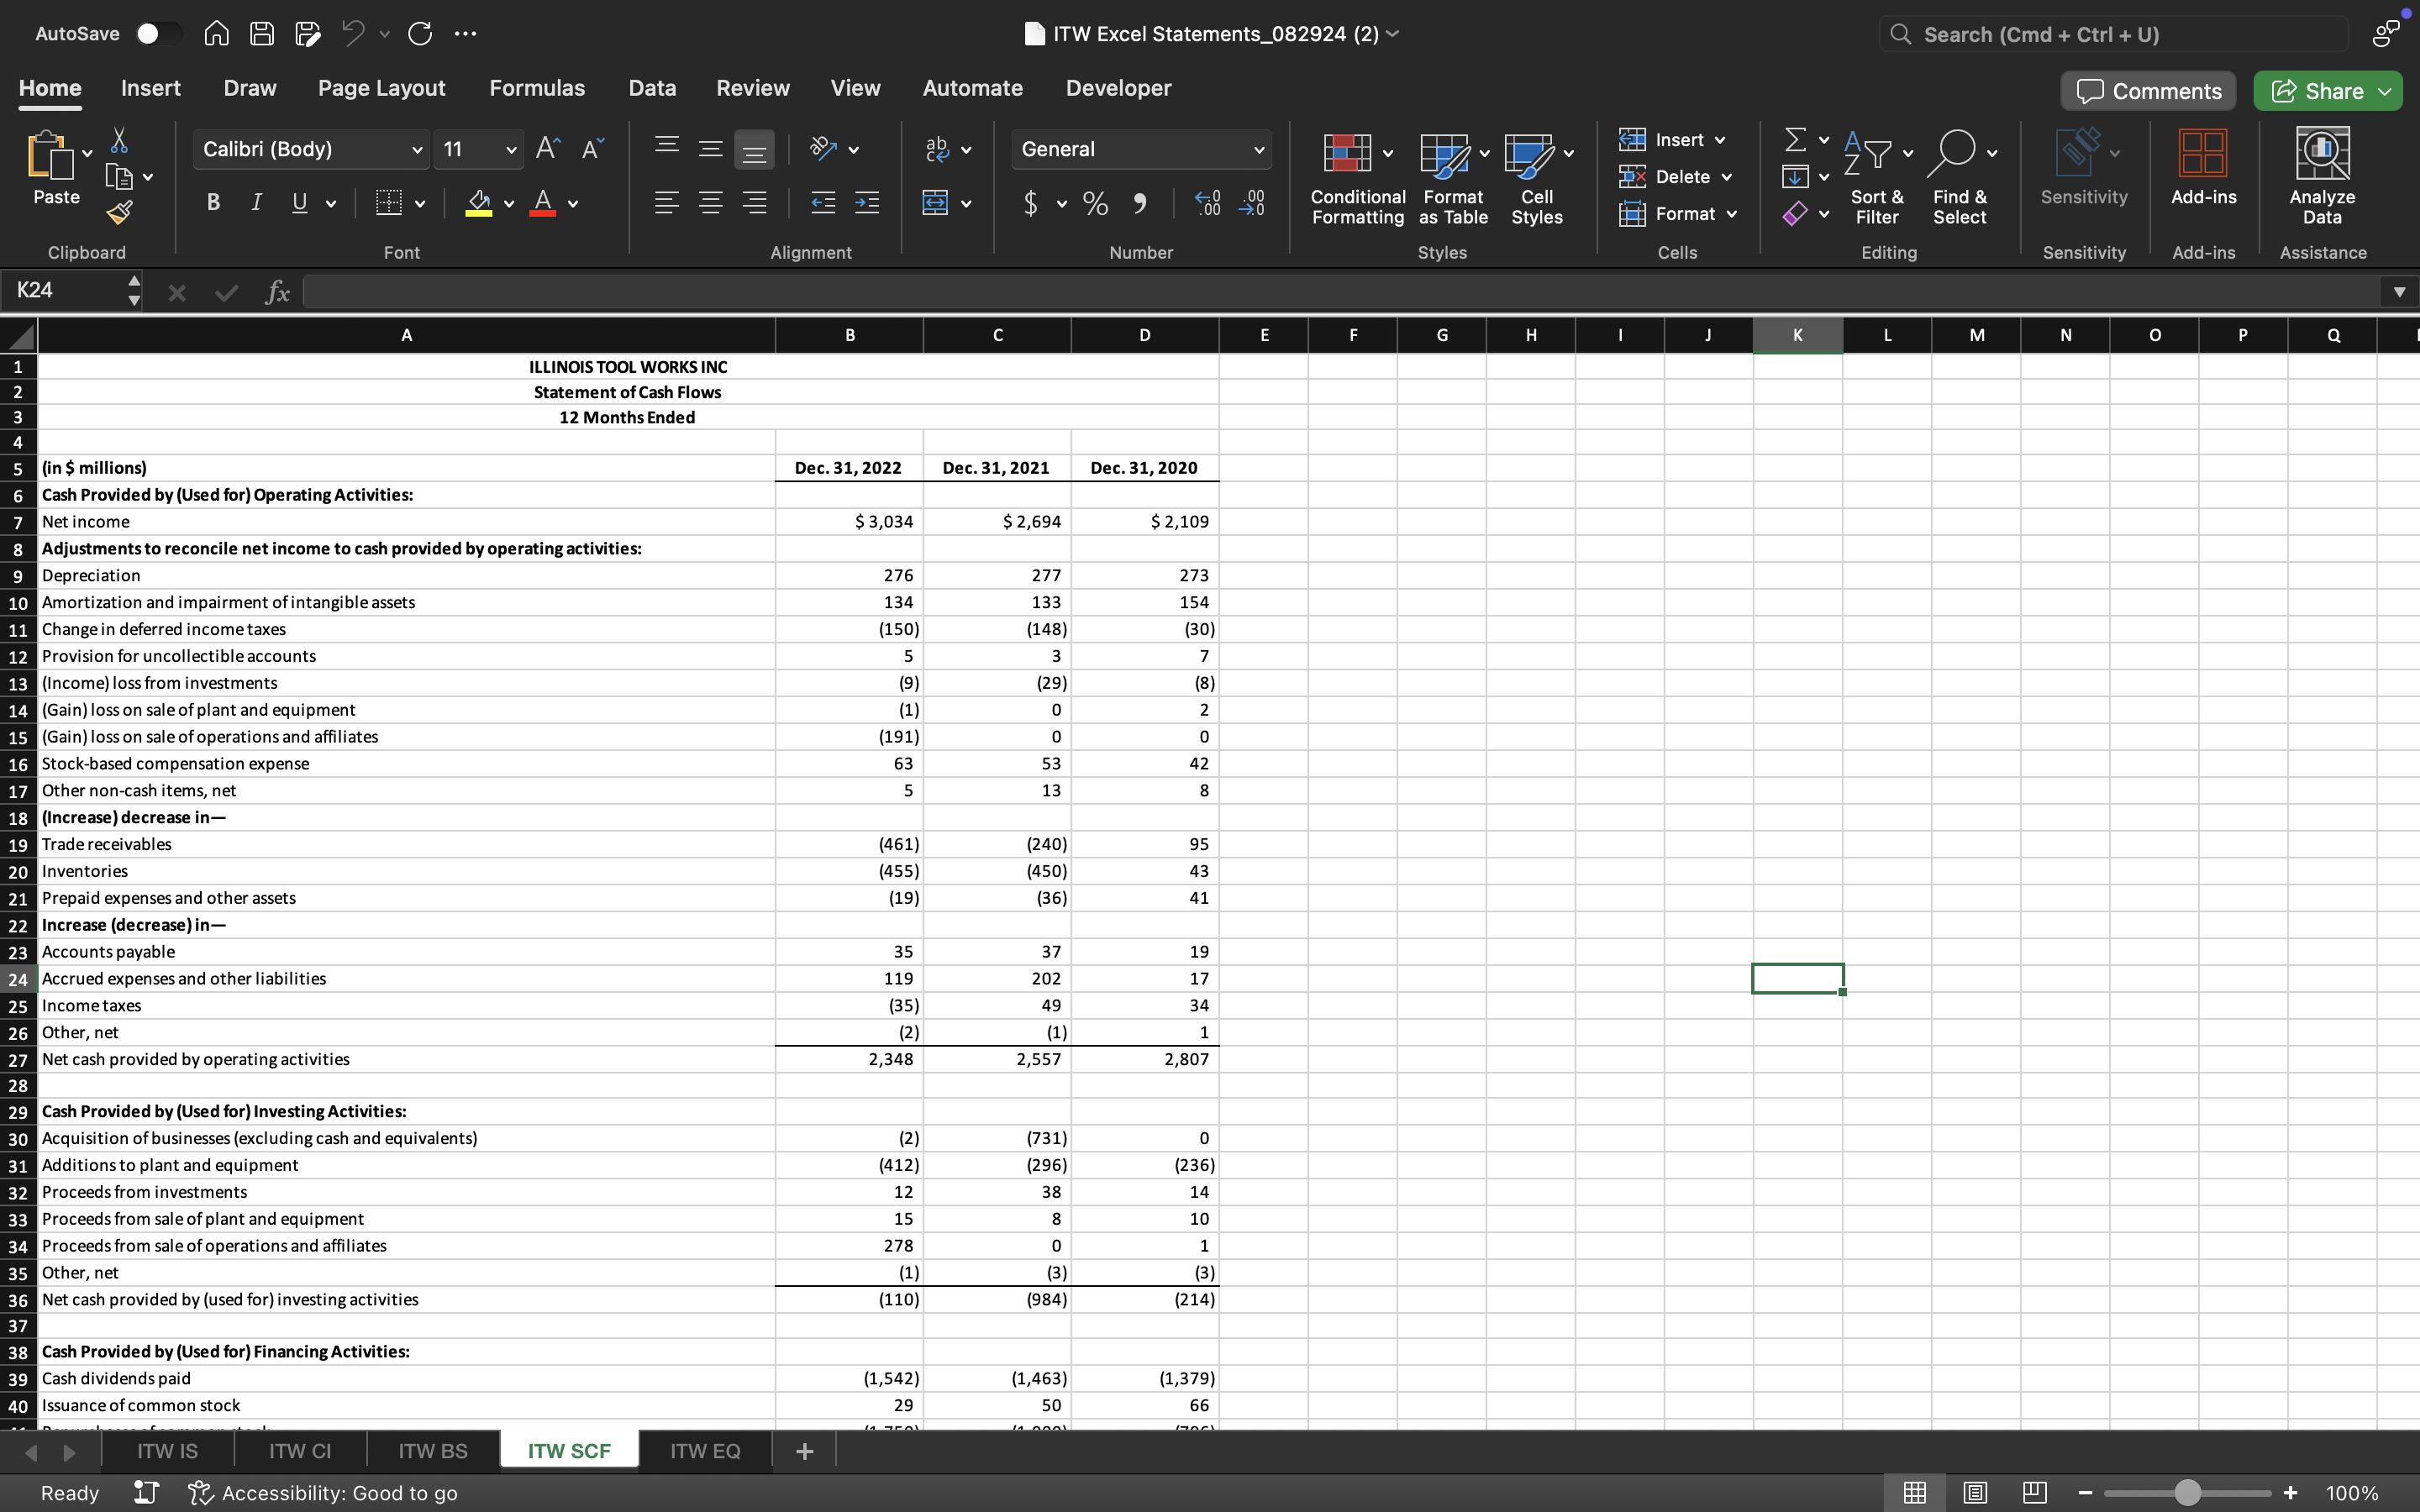
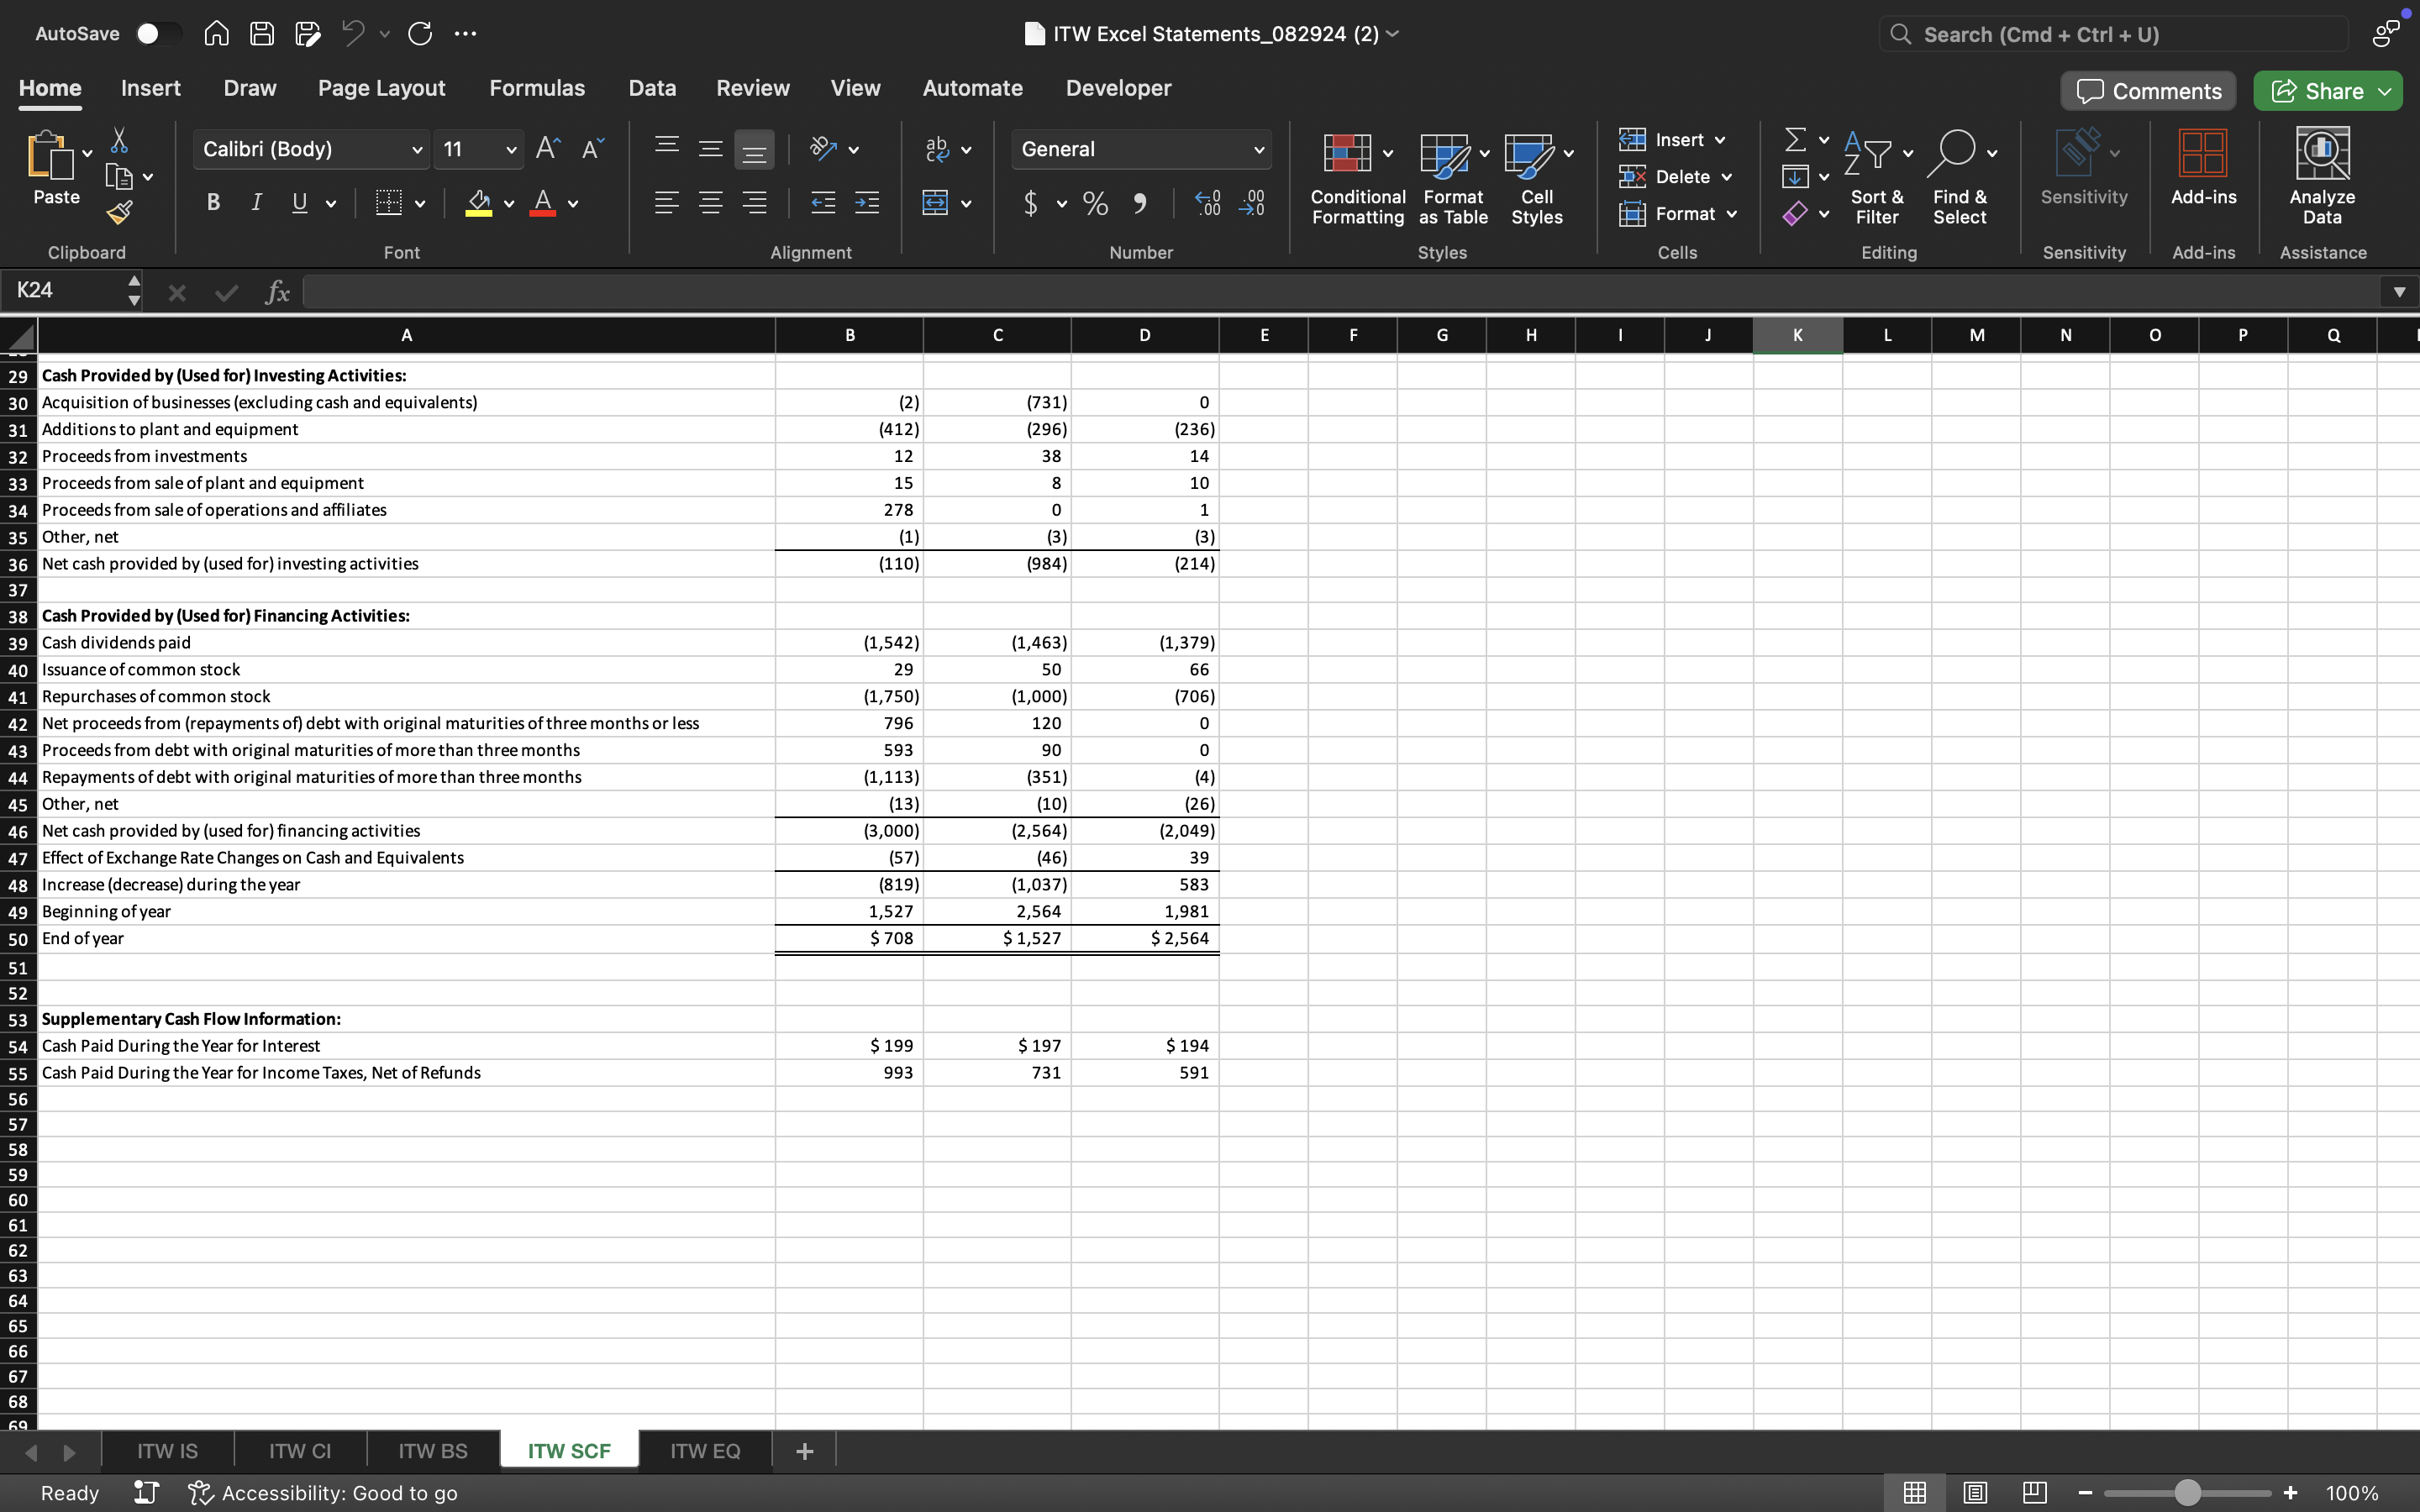
Statement of Cash Flows Analysis Determine the size and direction (cash source or use) of cash flows from operations, investing, and financing. One goal is to understand the company's pattern of cash flows. Complete the cash flow boxes below to better understand the cash flow pattern across the three years. Note: Use negative signs with answers when appropriate.
- Parker Hannifin
- Illinois Tool Works
| Parker Hannifin ($ thousands) | |||
|---|---|---|---|
| June 30, 2022 | June 30, 2021 | June 30, 2020 | |
| Cash flows from operations | Answer 1 | Answer 2 | Answer 3 |
| Cash from investing activities | Answer 4 | Answer 5 | Answer 6 |
| Cash from financing activities | Answer 7 | Answer 8 | Answer 9 |
| Effect of exchange rate changes on cash | Answer 10 | Answer 11 | Answer 12 |
| Total cash flow for the year | |||
| Cash at start of year | Answer 13 | Answer 14 | Answer 15 |
| Cash at end of year |
| Illinois Tool Works ($ millions) | |||
|---|---|---|---|
| Dec. 31, 2022 | Dec. 31, 2021 | Dec. 31, 2020 | |
| Cash flow from operations | Answer 16 | Answer 17 | Answer 18 |
| Cash flow from investing | Answer 19 | Answer 20 | Answer 21 |
| Cash flow from financing | Answer 22 | Answer 23 | Answer 24 |
| Effect of exchange rate changes on cash | Answer 25 | Answer 26 | Answer 27 |
| Total cash flow for the year | |||
| Cash at start of year | Answer 28 | Answer 29 | Answer 30 |
| Cash at end of year |
Question 4
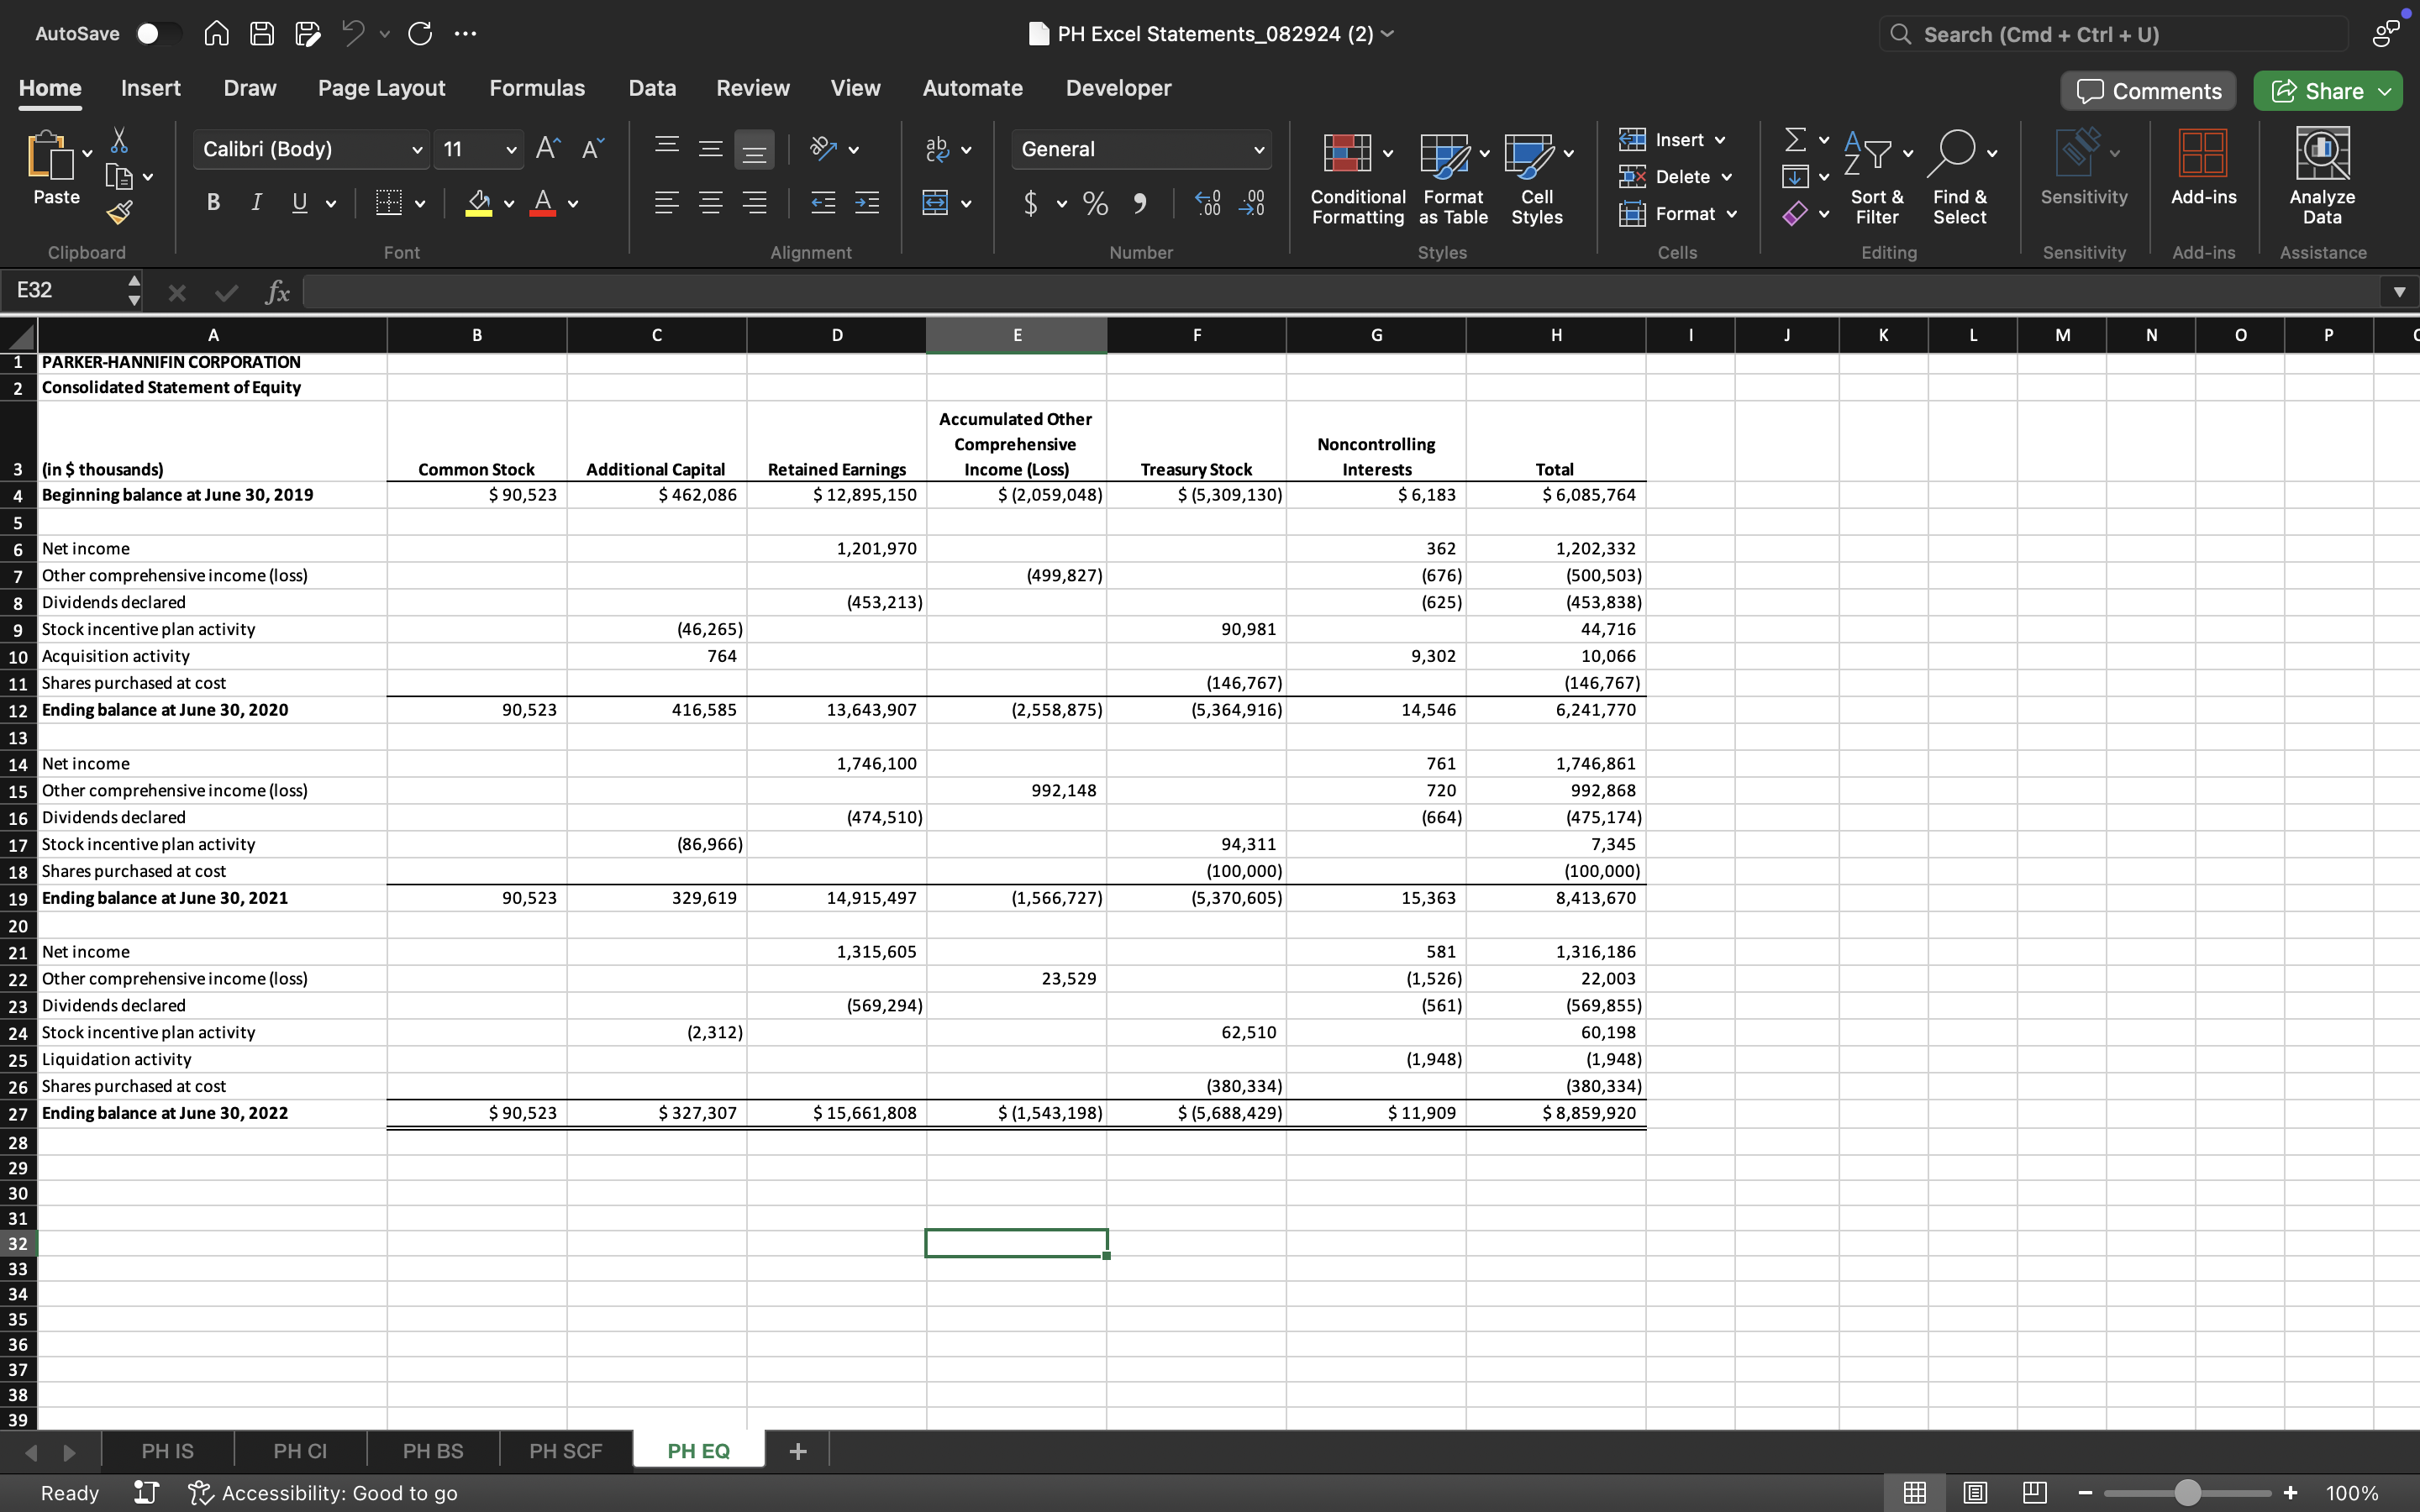
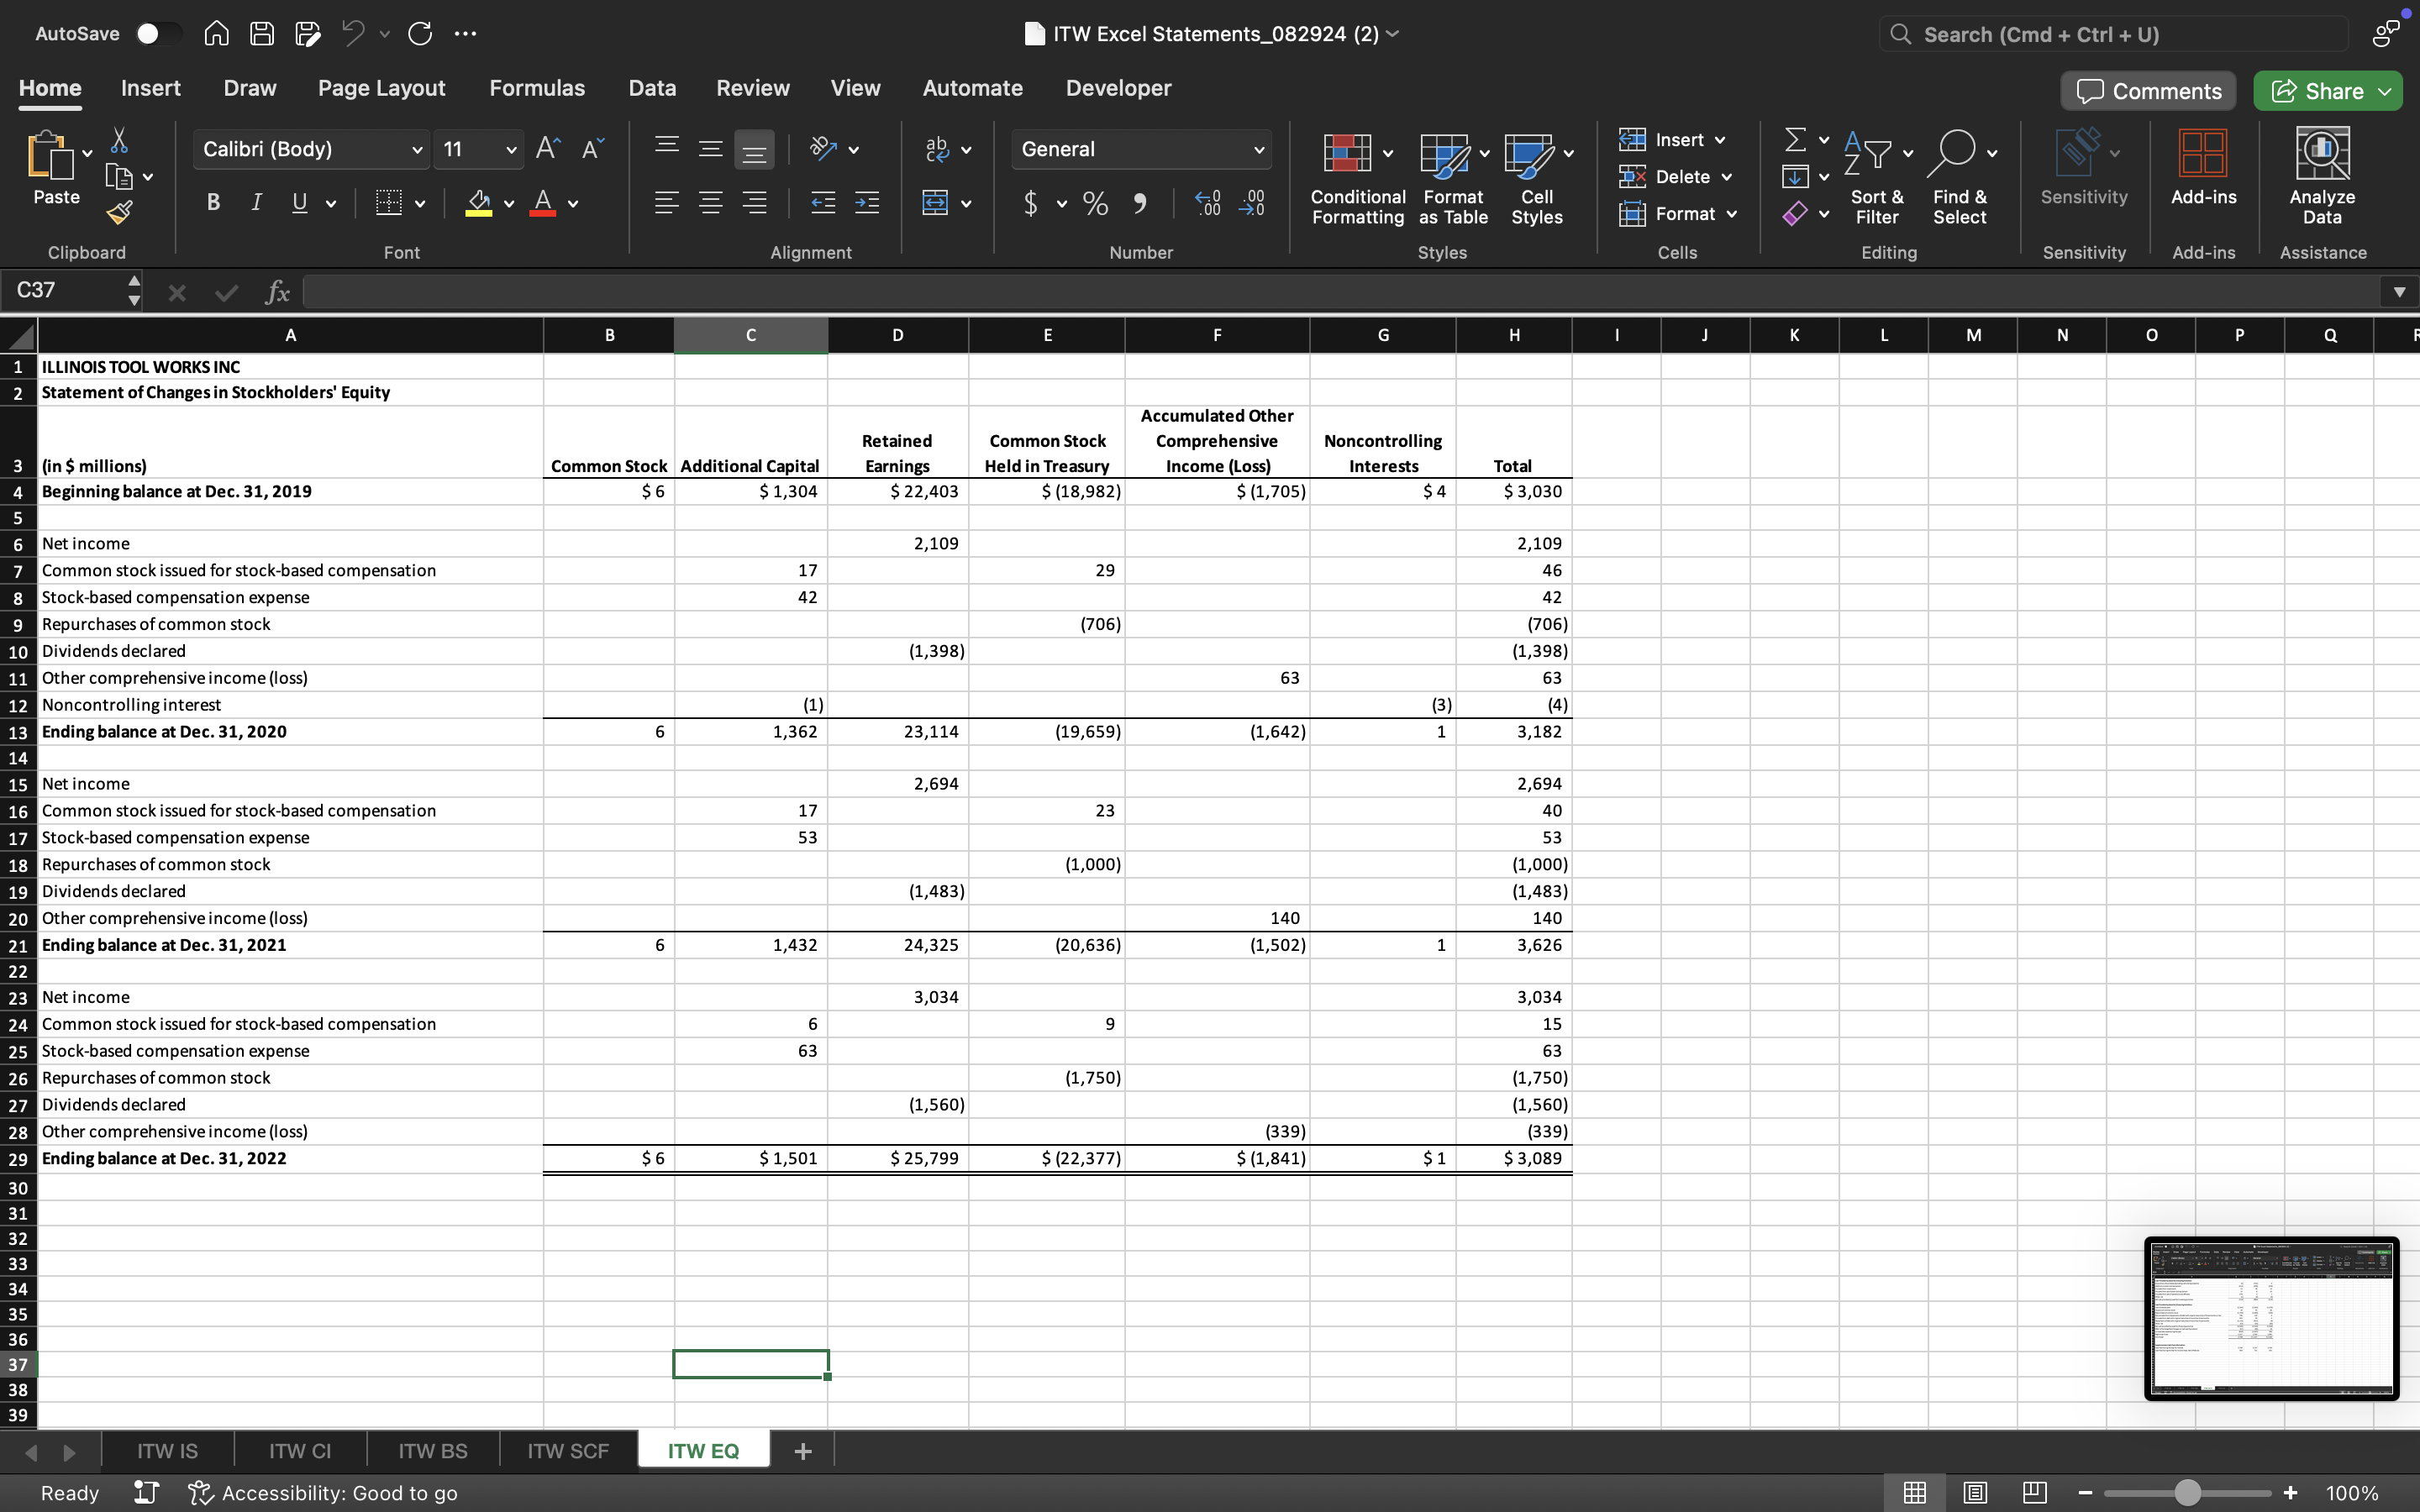
Financial Statements Articulation Complete the financial statement articulation for 2021-2022. Use Exhibit 2.5 as a reference as you complete the articulation. Note: Use negative signs with answers when appropriate.
- Parker Hannifin
- Illinois Tool Works
| Parker Hannifin ($ thousands) | |||||
|---|---|---|---|---|---|
| Balance Sheet | Statement of Cash Flows | Balance Sheet | |||
| June 30, 2021 | For the Year Ended June 30, 2022 | June 30, 2022 | |||
| Cash | Answer 1 | Operating Cash Flows | Answer 2 | Cash | Answer 3 |
| Noncash assets | Answer 4 | Investing Cash Flows | Answer 5 | Noncash assets | Answer 6 |
| Total assets | Financing Cash Flows (including ForEx) | Answer 7 | Total assets | ||
| Total liabilities | Answer 8 | Net change in cash | Total liabilities | Answer 9 | |
| Contributed capital | Answer 10 | Cash balance, June 30, 2021 | Answer 11 | Contributed capital | Answer 12 |
| Retained earnings | Answer 13 | Cash balance, June 30, 2022 | Retained earnings | Answer 14 | |
| Treasury stock | Answer 15 | Treasury stock | Answer 16 | ||
| AOCI (L) | Answer 17 | AOCI (L) | Answer 18 | ||
| Noncontrolling interest | Answer 19 | Noncontrolling interest | Answer 20 | ||
| Total equity | Total equity | ||||
| Liabilities and equity | Liabilities and equity |
| Parker Hannifin ($ thousands) | |||
|---|---|---|---|
| Income Statement | Statement of Shareholders' Equity | ||
| For Year Ended June 30, 2022 | For Year Ended June 30, 2022 | ||
| Revenues | Answer 21 | Contributed capital | |
| Expenses | Answer 22 | June 30, 2021 | Answer 23 |
| Net earnings | Stock issuance and other | Answer 24 | |
| June 30, 2022 | |||
| Retained earnings | |||
| June 30, 2021 | Answer 25 | ||
| Net income | Answer 26 | ||
| Dividends and other changes | Answer 27 | ||
| June 30, 2022 | |||
| Treasury stock | |||
| June 30, 2021 | Answer 28 | ||
| Stock (repurchases) re-issuances | Answer 29 | ||
| June 30, 2022 | |||
| AOCI (L) | |||
| June 30, 2021 | Answer 30 | ||
| Comprehensive income (loss) | Answer 31 | ||
| June 30, 2022 | |||
| Noncontrolling interest | |||
| June 30, 2021 | Answer 32 | ||
| Change in noncontrolling interest | Answer 33 | ||
| June 30, 2022 |
| Illinois Tool Works ($ millions) | |||||
|---|---|---|---|---|---|
| Balance Sheet | Statement of Cash Flows | Balance Sheet | |||
| December 31, 2021 | For the Year Ended December 31, 2022 | December 31, 2022 | |||
| Cash | Answer 34 | Operating Cash Flows | Answer 35 | Cash | Answer 36 |
| Noncash assets | Answer 37 | Investing Cash Flows | Answer 38 | Noncash assets | Answer 39 |
| Total assets | Financing Cash Flows (including ForEx) | Answer 40 | Total assets | ||
| Total liabilities | Answer 41 | Net change in cash | Total liabilities | Answer 42 | |
| Contributed capital | Answer 43 | Cash balance, December 31, 2021 | Answer 44 | Contributed capital | Answer 45 |
| Retained earnings | Answer 46 | Cash balance, December 31, 2022 | Retained earnings | Answer 47 | |
| Treasury stock | Answer 48 | Treasury stock | Answer 49 | ||
| AOCI (L) | Answer 50 | AOCI (L) | Answer 51 | ||
| Noncontrolling interest | Answer 52 | Noncontrolling interest | Answer 53 | ||
| Total equity | Total equity | ||||
| Total liabilities and equity | Total liabilities and equity |
| Illinois Tool Works ($ millions) | |||
|---|---|---|---|
| Income Statement | Statement of Shareholders' Equity | ||
| For Year Ended December 31, 2022 | For Year Ended December 31, 2022 | ||
| Revenues | Answer 54 | Contributed capital | |
| Expenses | Answer 55 | December 31, 2021 | Answer 56 |
| Net earnings | Stock issuance and other | Answer 57 | |
| December 31, 2022 | |||
| Retained earnings | |||
| December 31, 2021 | Answer 58 | ||
| Net income | Answer 59 | ||
| Dividends and stock repurchases | Answer 60 | ||
| December 31, 2022 | |||
| Treasury stock | |||
| December 31, 2021 | Answer 61 | ||
| Stock (repurchases) re-issuances | Answer 62 | ||
| December 31, 2022 | |||
| AOCI (L) | |||
| December 31, 2021 | Answer 63 | ||
| Comprehensive income (loss) | Answer 64 | ||
| December 31, 2022 | |||
| Noncontrolling interest | |||
| December 31, 2021 | Answer 65 | ||
| Other changes in equity | Answer 66 | ||
| December 31, 2022 |
Question 5
Market Capitalization Determine the market capitalization for each firm for the FY2022 year-end. Determine the number of shares outstanding from the balance sheet. Recall that shares outstanding is total shares issued less any treasury shares. Obtain the year-end stock price (or closing price on the last trading day before year end) from an investment website such as Seeking Alpha or Yahoo Finance.HINT:Use Close not Adjusted Close when obtaining year-end stock prices.
Note:For Parker Hannifin, enter shares outstanding in thousands to three decimal places (do not round amount).
| Parker Hannifin | |||
|---|---|---|---|
| June 30, 2022 | |||
| Shares outstanding at year end | Answer 1 | thousand | |
| Market price per share at year end | Answer 2 | price per share | |
| Market capitalization at year end | thousand |
Note:For Illinois Tool Works, enter shares outstanding in millions to one decimal place, if applicable (do not round amount).
| Illinois Tool Works | |||
|---|---|---|---|
| Dec. 31, 2022 | |||
| Shares outstanding at year end | Answer 3 | million | |
| Market price per share at year end* | Answer 4 | price per share | |
| Market capitalization at year end | million |
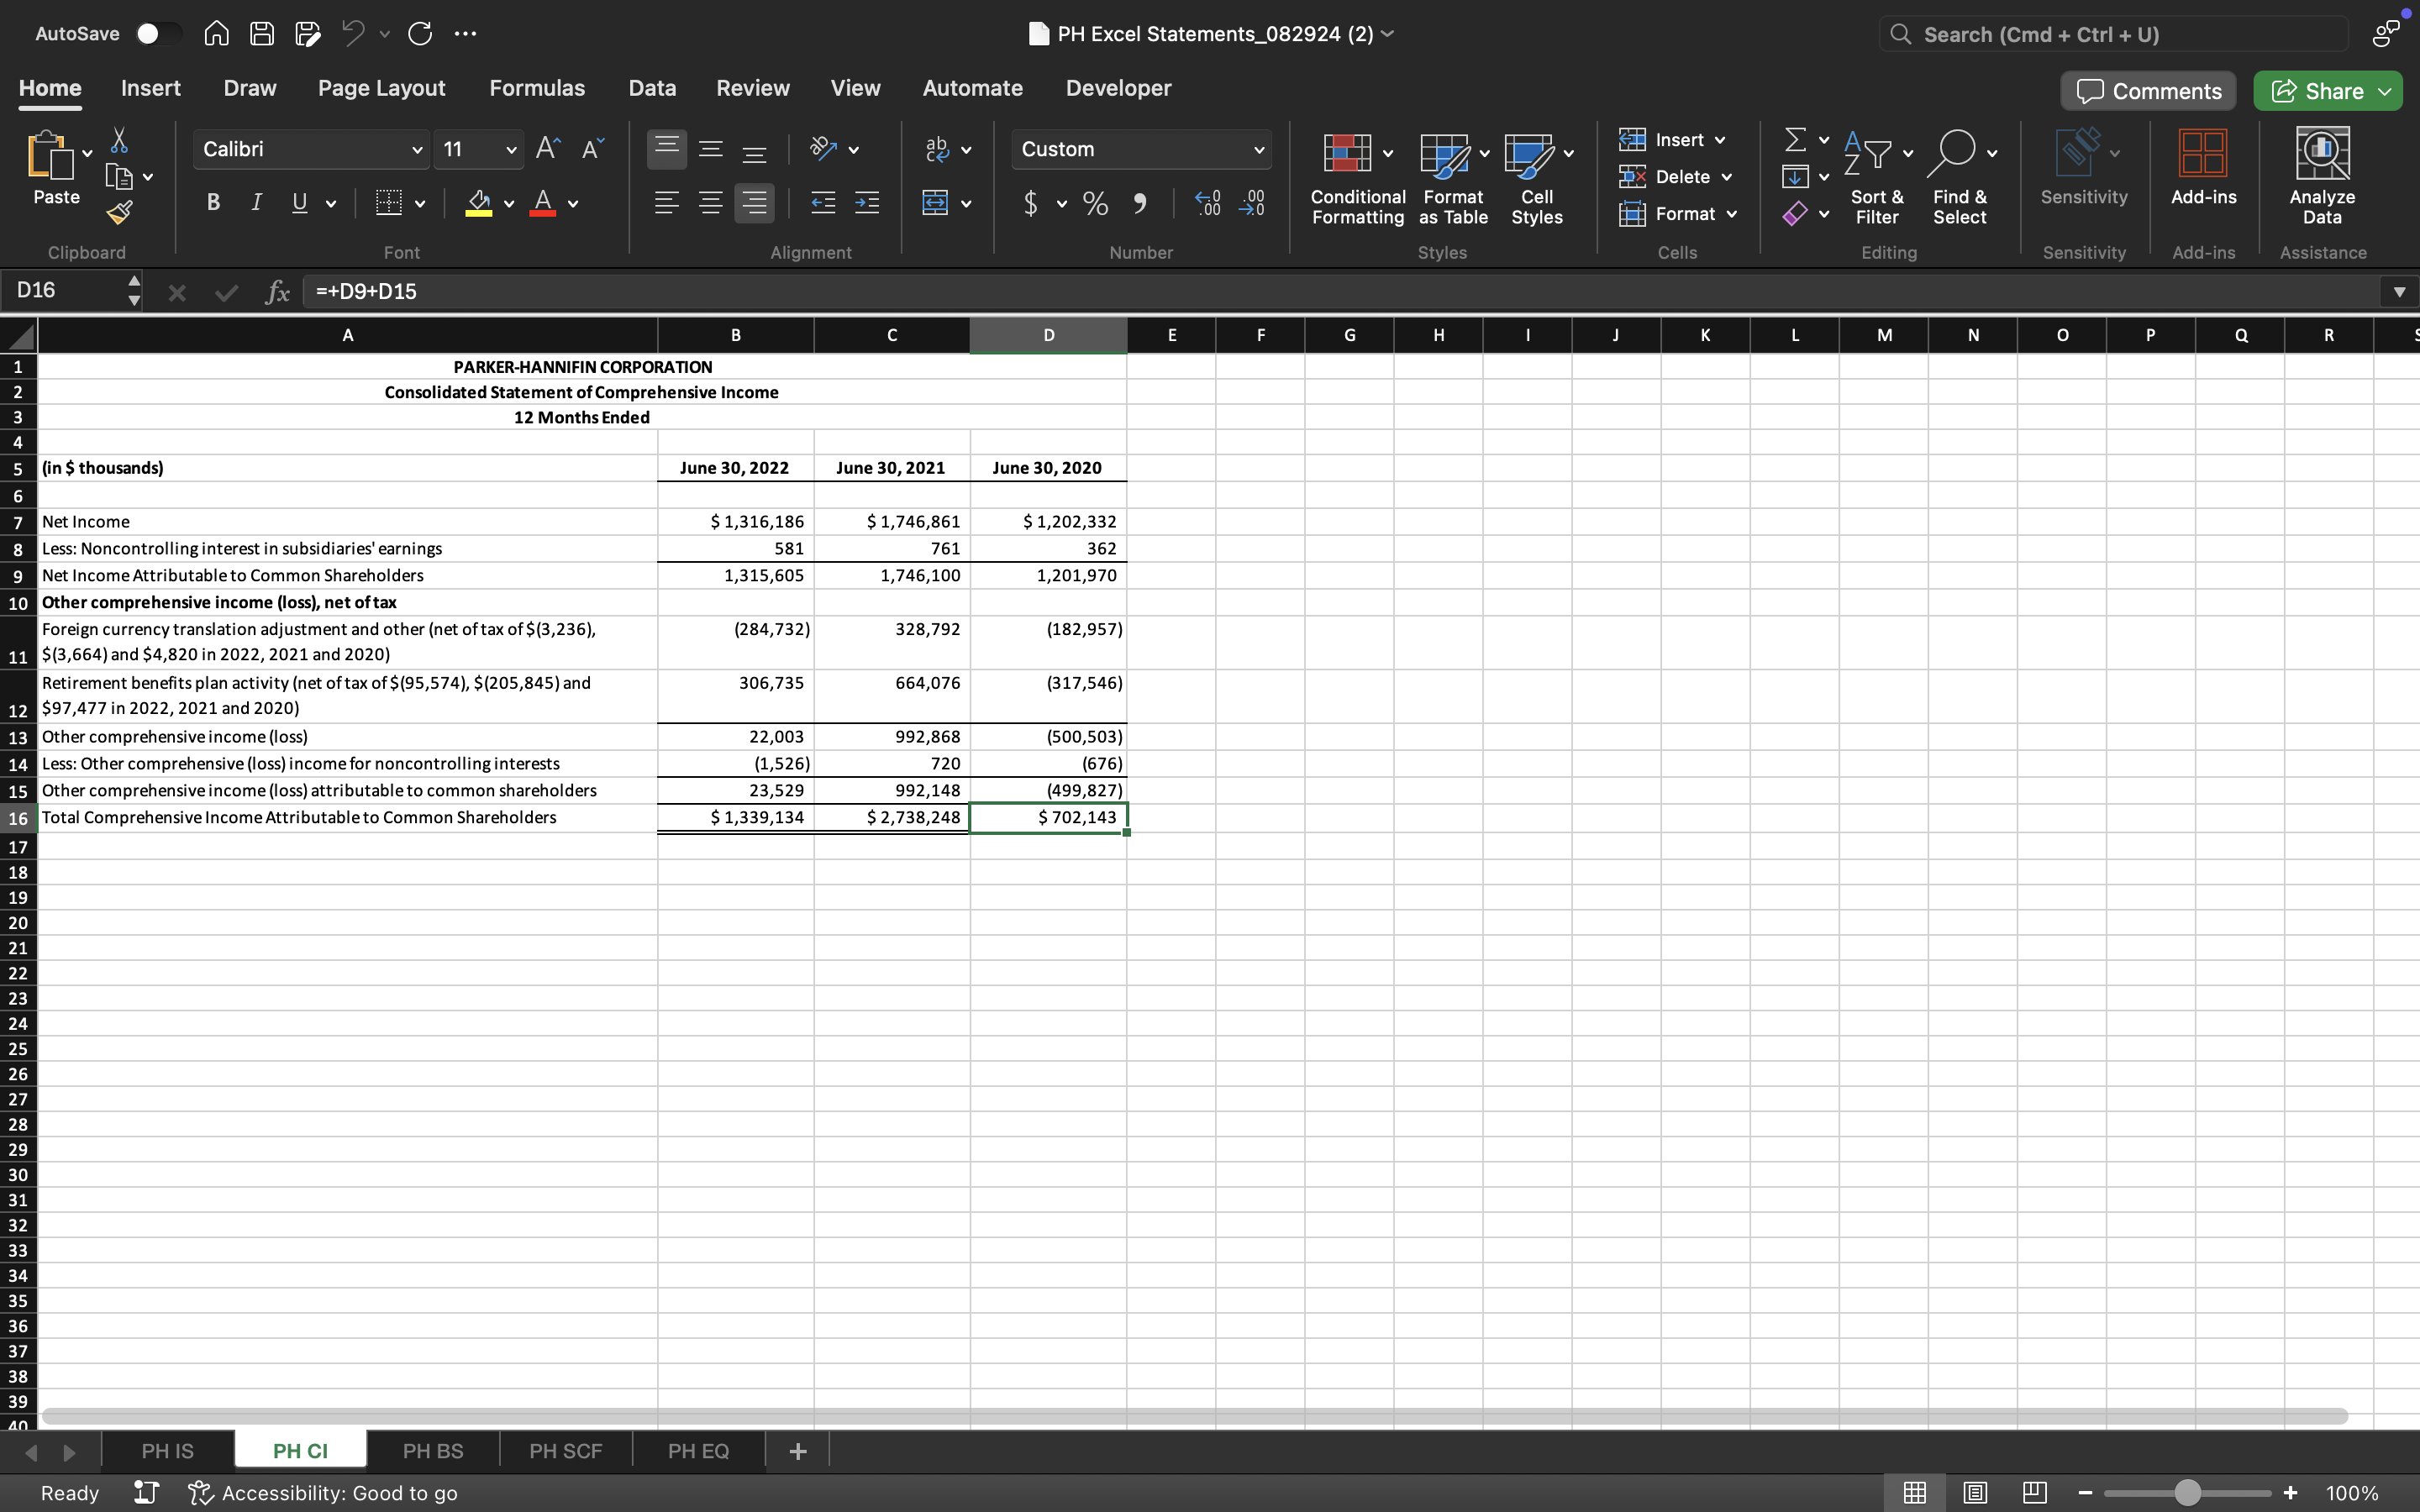
Use these excel screenshots as References
Parker Hannifin
Step by Step Solution
There are 3 Steps involved in it

Get step-by-step solutions from verified subject matter experts