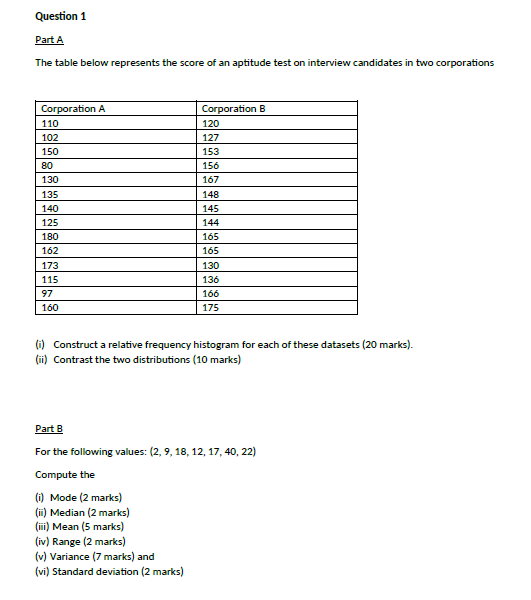
Question: Question 1 Part A The table below represents the score of an aptitude test on interview candidates in two corporations Corporation A Corporation B 110

Question 1 Part A The table below represents the

Question 1 Part A The table below represents the score of an aptitude test on interview candidates in two corporations Corporation A Corporation B 110 120 102 127 150 153 80 156 130 167 135 148 140 145 125 144 180 165 162 165 173 130 115 136 97 166 160 175 (i) Construct a relative frequency histogram for each of these datasets (20 marks). (ii) Contrast the two distributions (10 marks) Part B For the following values: (2, 9, 18, 12, 17, 40, 22) Compute the (i) Mode (2 marks) (ii) Median (2 marks) (iii) Mean (5 marks) (iv) Range (2 marks) (v) Variance (7 marks) and (vi) Standard deviation (2 marks)

Step by Step Solution

There are 3 Steps involved in it

1 Expert Approved Answer
Step: 1 Unlock blur-text-image
Question Has Been Solved by an Expert!

Get step-by-step solutions from verified subject matter experts

Step: 2 Unlock
Step: 3 Unlock

Students Have Also Explored These Related General Management Questions!