

Question: Question 1 Performance analysis and utility maximisation (13 marks) Not yet saved Marked out of An investment manager collected historical data of the market over
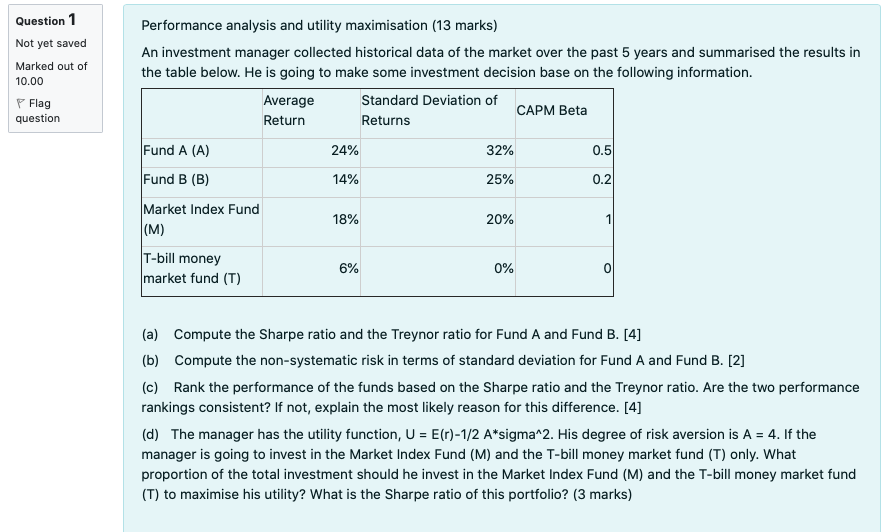
Question 1 Performance analysis and utility maximisation (13 marks) Not yet saved Marked out of An investment manager collected historical data of the market over the past 5 years and summarised the results in the table below. He is going to make some investment decision base on the following information. 10.00 Standard Deviation of Flag question Average Return CAPM Beta Returns Fund A (A) 24% 32% 0.5 14% 25% 0.2 Fund B (B) Market Index Fund (M) 18% 20% 1 T-bill money market fund (T) 6% 0% 0 (a) Compute the Sharpe ratio and the Treynor ratio for Fund A and Fund B. [4] (b) Compute the non-systematic risk in terms of standard deviation for Fund A and Fund B. [2] (c) Rank the performance of the funds based on the Sharpe ratio and the Treynor ratio. Are the two performance rankings consistent? If not, explain the most likely reason for this difference. [4] (d) The manager has the utility function, U = E(r)-1/2 A*sigma 2. His degree of risk aversion is A = 4. If the manager is going to invest in the Market Index Fund (M) and the T-bill money market fund (T) only. What proportion of the total investment should he invest in the Market Index Fund (M) and the T-bill money market fund (T) to maximise his utility? What is the Sharpe ratio of this portfolio
Step by Step Solution
There are 3 Steps involved in it

Get step-by-step solutions from verified subject matter experts