

Question: Question 1: Place in this spreadsheet the data on SUVs and Minivans. Your variables of interest are COMB (mpg) and C02 Emissions (g/km). Question 2:
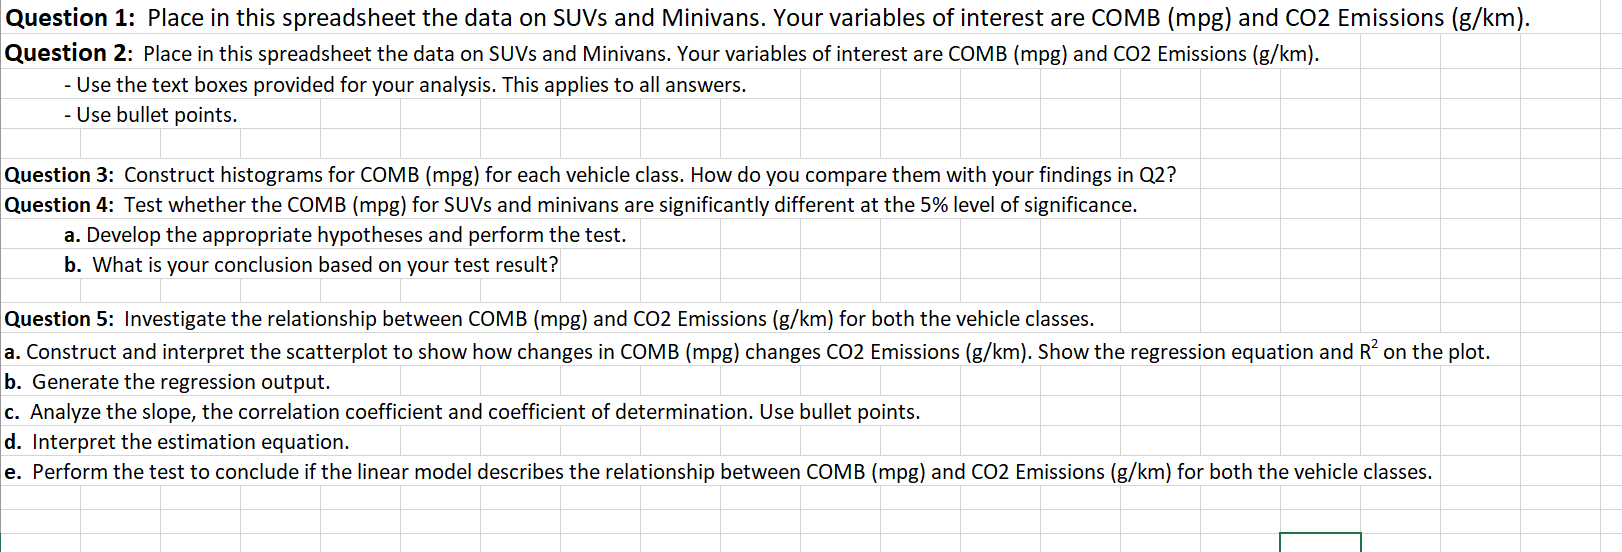
Question 1: Place in this spreadsheet the data on SUVs and Minivans. Your variables of interest are COMB (mpg) and C02 Emissions (g/km). Question 2: Place in this spreadsheet the data on SUVs and Minivans. Your variables of interest are COMB (mpg) and C02 Emissions (g/km). - Use the text boxes provided for your analysis. This applies to all answers. - Use bullet points. Question 3: Construct histograms for COMB (mpg) for each vehicle class. How do you compare them with your findings in 02? Question 4: Test whether the COMB (mpg) for SUVs and minivans are significantly different at the 5% level of significance. 3. Develop the appropriate hypotheses and perform the test. b. What is your conclusion based on your test result? Question 5: Investigate the relationship between COMB (mpg) and C02 Emissions (g/km) for both the vehicle classes. a. Construct and interpret the scatterplot to show how changes in COMB (mpg) changes C02 Emissions (g/km). Show the regression equation and R2 on the plot. b. Generate the regression output. c. Analyze the slope, the correlation coefficient and coefficient of determination. Use bullet points. d. Interpret the estimation equation. e. Perform the test to conclude ifthe linear model describes the relationship between COMB (mpg) and C02 Emissions (g/km) for both the vehicle classes. ll
Step by Step Solution
There are 3 Steps involved in it

Get step-by-step solutions from verified subject matter experts