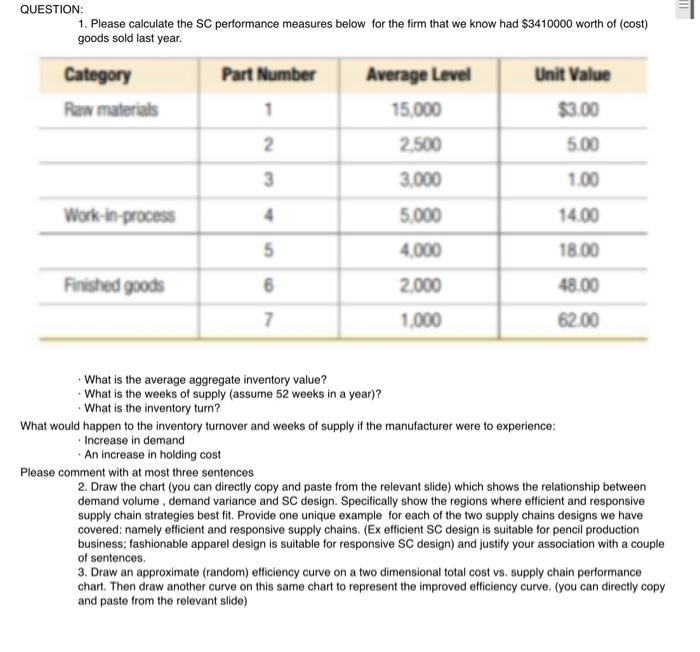
Question: QUESTION: 1. Please calculate the SC performance measures below for the firm that we know had $3410000 worth of (cost) goods sold last year. Category

QUESTION: 1. Please calculate the SC performance
QUESTION: 1. Please calculate the SC performance measures below for the firm that we know had $3410000 worth of (cost) goods sold last year. Category Part Number Unit Value Average Level 15.000 Raw materials 1 $3.00 2 2500 5.00 3 3.000 1.00 Work-in-process 4 5.000 14.00 5 4.000 18.00 Finished goods 6 2.000 48.00 7 1.000 62.00 What is the average aggregate inventory value? What is the weeks of supply (assume 52 weeks in a year)? What is the inventory turn? What would happen to the inventory turnover and weeks of supply if the manufacturer were to experience: Increase in demand . An increase in holding cost Please comment with at most three sentences 2. Draw the chart (you can directly copy and paste from the relevant slide) which shows the relationship between demand volume demand variance and SC design. Specifically show the regions where efficient and responsive supply chain strategies best fit. Provide one unique example for each of the two supply chains designs we have covered: namely efficient and responsive supply chains. (Ex efficient SC design is suitable for pencil production business, fashionable apparel design is suitable for responsive SC design) and justify your association with a couple of sentences 3. Draw an approximate (random) efficiency curve on a two dimensional total cost vs. supply chain performance chart. Then draw another curve on this same chart to represent the improved efficiency curve. (you can directly copy and paste from the relevant slide)

Step by Step Solution

There are 3 Steps involved in it

1 Expert Approved Answer
Step: 1 Unlock blur-text-image
Question Has Been Solved by an Expert!

Get step-by-step solutions from verified subject matter experts

Step: 2 Unlock
Step: 3 Unlock

Students Have Also Explored These Related General Management Questions!