

Question: Question 1: Please examine the following forecasting report prepared by a contractor and address the following questions: 1. Would you accept or reject this report?
Question 1:
Please examine the following forecasting report prepared by a contractor and address the following questions:
1. Would you accept or reject this report? Why? List all applicable justifications.
2. Explain a step-by-step approach to produce a highly rigorous forecasting report for the company. Make sure to provide all the required details and guidance (without calculations).
FORECASTING REPORT
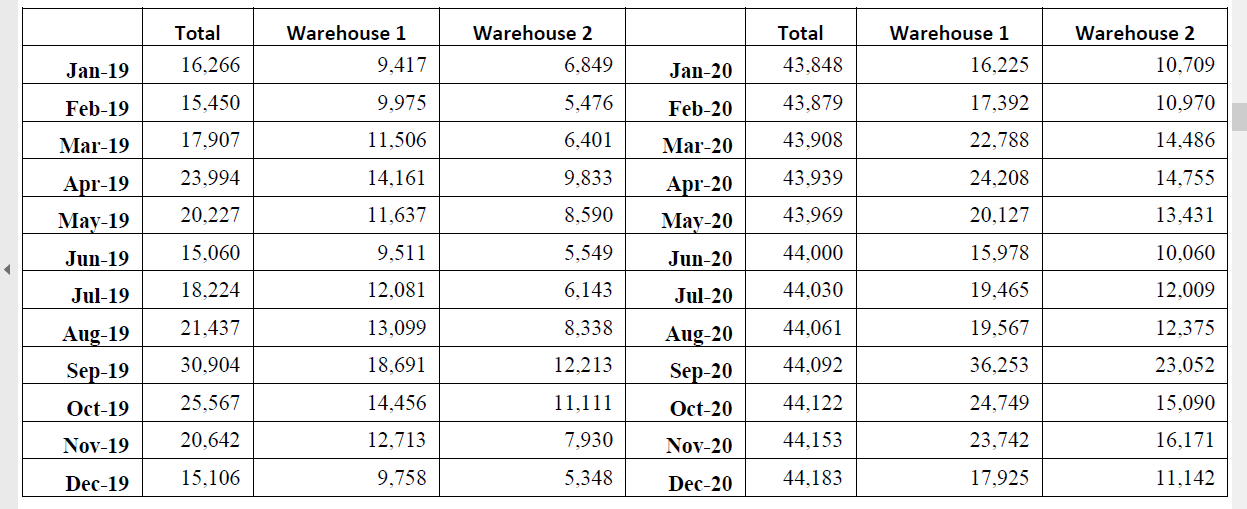
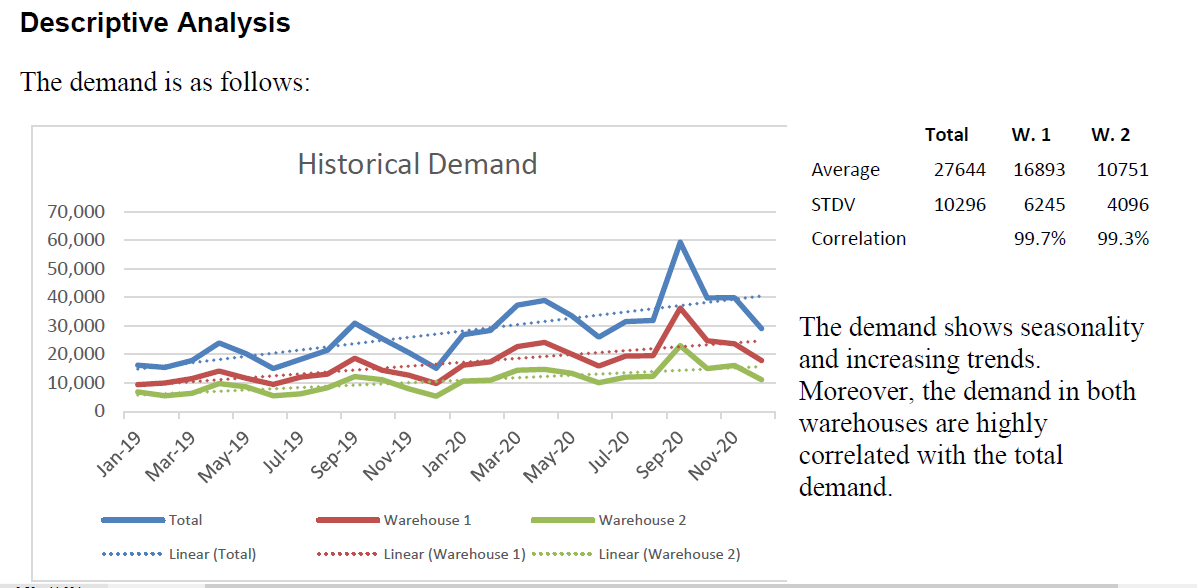
The company operates two warehouses. The historical demand is as follows:
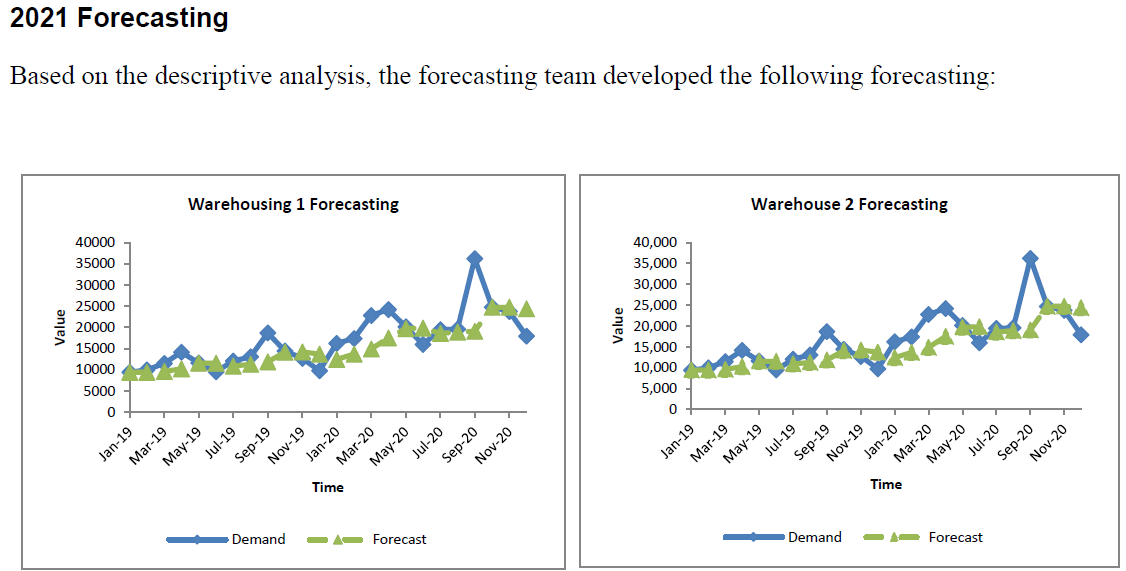
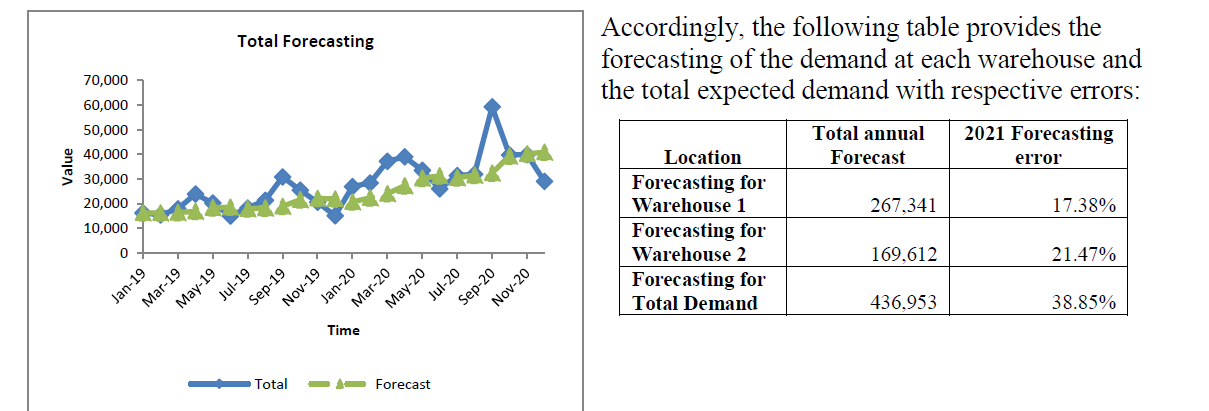
Based on the seasonal index for each data set (i.e., total demand, warehouse 1 and warehouse 2 and the 2021 First Month Forecasts, the following figure provides the monthly forecasts for each data series:
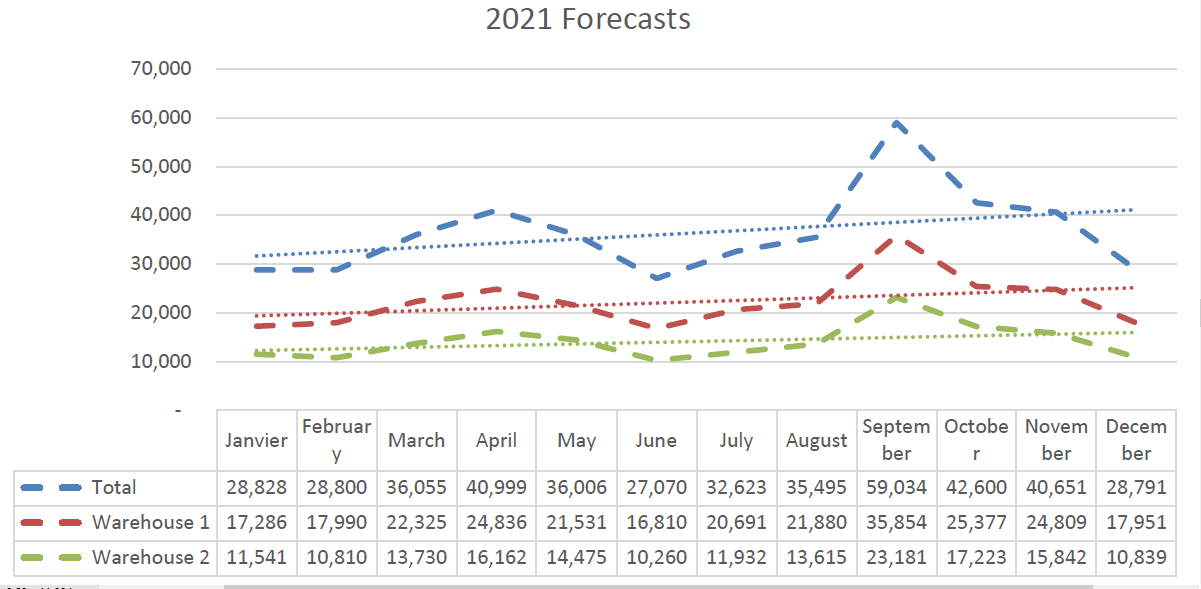
Total 16.266 Warehouse 1 9,417 Warehouse 2 6.849 Total 43,848 Warehouse 1 16,225 Warehouse 2 10,709 Jan-19 Jan-20 Feb-19 15.450 9,975 5,476 Feb-20 43.879 17,392 10,970 Mar-19 17,907 11,506 6.401 Mar-20 43,908 22,788 14,486 23,994 14,161 9.833 43,939 24,208 14,755 Apr-19 May-19 20.227 11.637 8.590 Apr-20 May-20 43,969 20.127 13,431 Jun-19 15,060 9,511 5.549 Jun-20 44,000 15,978 10.060 Jul-19 18.224 12,081 6.143 Jul-20 44.030 19,465 12,009 21,437 13,099 8,338 Aug-20 44,061 19,567 12.375 Aug-19 Sep-19 30,904 18,691 12.213 44,092 36,253 23.052 Sep-20 Oct-20 Oct-19 25.567 14,456 11,111 44,122 24,749 15,090 Nov-19 20,642 12,713 7,930 Nov-20 44,153 23,742 16,171 Dec-19 15,106 9,758 5,348 Dec-20 44,183 17,925 11.142 Descriptive Analysis The demand is as follows: Total W.1 W.2 Historical Demand Average 27644 16893 10751 STDV 10296 6245 4096 Correlation 99.7% 99.3% 70,000 60,000 50,000 40,000 30,000 20,000 10,000 an 0 The demand shows seasonality and increasing trends. Moreover, the demand in both warehouses are highly correlated with the total demand. Jan-19 Sep-19 May-20 Mar-20 Jul-20 Nov-20 Mar-19 Jul-19 May-19 Nov-19 Jan-20 Sep-20 Total Warehouse 1 Warehouse 2 Linear (Total) *** Linear (Warehouse 1) Linear (Warehouse 2) 2021 Forecasting Based on the descriptive analysis, the forecasting team developed the following forecasting: Warehousing 1 Forecasting Warehouse 2 Forecasting 40000 35000 30000 25000 20000 15000 10000 5000 Value 40,000 35,000 30,000 25,000 20,000 15,000 10,000 5,000 vetene 0 0 Mar-19 Jan-19 Sep-19 1/2 Marzo - Jan-20 Mar-20 May-20 Nov-19 Sep-19 Sep-20 Nov-20 Jan-19 Mar-19 Nov-20 Sep-20 Jul-20 May-19 Jul-19 Nov-19 Jan-20 May-20 Jul-20 May-19 Jul-19 Time Demand - Forecast Demand - Forecast Total Forecasting 70,000 60,000 50,000 $ 40,000 30,000 20,000 Accordingly, the following table provides the forecasting of the demand at each warehouse and the total expected demand with respective errors: Total annual 2021 Forecasting Location Forecast Forecasting for Warehouse 1 267,341 17.38% Forecasting for Warehouse 2 169.612 21.47% Forecasting for Total Demand 436,953 38.85% error 10,000 0 Mar-19 May-19 Jan-19 Sep-19 Jan-20 Nov-20 Sep-20 Jul-19 Nov-19 Time Mar-20 May-20 Jul-20 Total - Forecast 2021 Forecasts 70,000 60,000 50,000 40,000 30,000 20,000 10,000 Februar Janvier March April May June July August Septem Octobe Novem Decem ber r ber ber Total 28,828 28,800 36,055 40,999 36,006 27,070 32,623 35,495 59,034 42,600 40,651 28,791 Warehouse 1 17,286 17,990 22,325 24,836 21,531 16,810 20,691 21,880 35,854 25,377 24,809 17,951 Warehouse 2 11,541 10,810 13,730 16,162 14,475 10,260 11,932 13,615 23,181 17,223 15,842 10,839
Step by Step Solution
There are 3 Steps involved in it

Get step-by-step solutions from verified subject matter experts